VMware: How to monitor your VCSA 6.5 using SNMP and PRTG Network Monitor
 Greetings friends, as I have told you in previous posts, and surely you are seeing in all media, vCenter for Windows will be obsolete in the next version of VMware, which makes us start migrating to vCenter Server Appliance for Linux (VCSA 6.5).
The new VCSA 6.5 comes with many enhancements such as HA, Backup, and very basic web monitoring to see CPU and RAM, I leave you some interesting articles:
- VMware: Cómo actualizar de manera sencilla VMware vCenter Server Appliance 6.5 al nuevo 6.5 Update 1 (VCSA 6.5 U1)
- VMware: Cómo resetar la password de root de VCSA 6.5 en 60 segundos
- VMware: Cómo configurar VCSA 6.5 HA, la nueva alta disponibilidad de vCenter Server Appliance
- VMware: Backup de vCenter Server Appliance (VCSA) 6.5
- VMware: Restore de vCenter Server Appliance (VCSA) 6.5
- VMware: Instalando VCSA 6.0 U1, y vistazo rápido a novedades VAMI y PSC Web Client
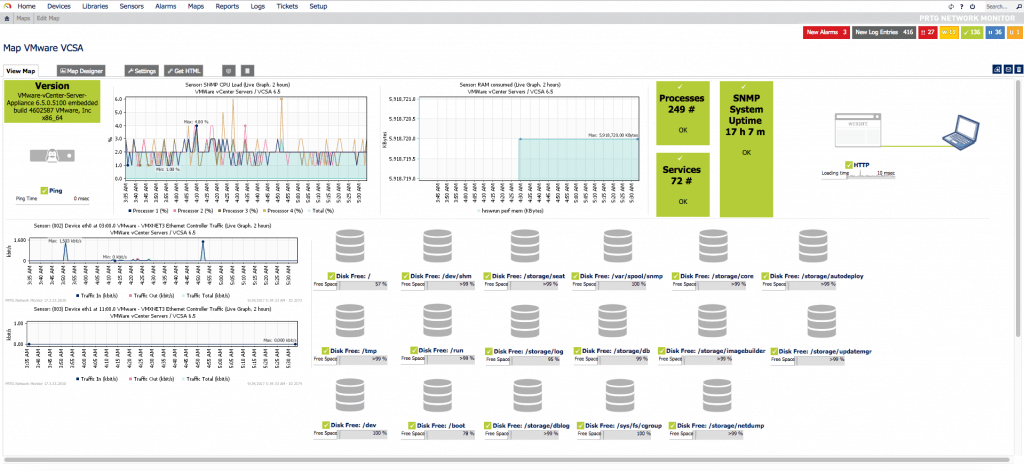
Without further delay, let’s start the article, at the end we can have a Dashboard similar to this one using the always recommended PRTG Network Monitor:
How to enable SNMP in VCSA 6.5
The first step is to activate SNMP in our VCSA 6.5, to do this we will log in through SSH, without entering the shell, we will launch the command snmp. get, to check the state of our SNMP:
We see that for now it is disabled with what we can go to the next step, which is to configure it and add the Hosts that we want to receive traps.
In the following command I’m going to configure SNMP in a basic way using the public community, at the same time I’m going to tell you that I want you to send me all the traps to the PRTG Host, and later on I want you to only send me the warning and error notifications.
There are four levels of logging for debug|info|warning|error traps (“debug” is the most detailed, and “error” the least detail). Come on, don’t forget the snmp. enable command to enable it:
If we launch the snmp. get command again now, we’ll see the result of our configuration:
We could also throw a test trap at our PRTG:
Now that we already have SNMP running, we could from a computer with VCSA’s IP access launch the following command that will give us back everything it’s showing by SNMP:
Algo así veremos si todo ha ido bien:
Something like this, we’ll see if everything went well.
Importing VMware MIBs into PRTG
This step is important, but fortunately for you, we already have the step-by-step in another blog post:
Configuring the Trap Sensor in PRTG
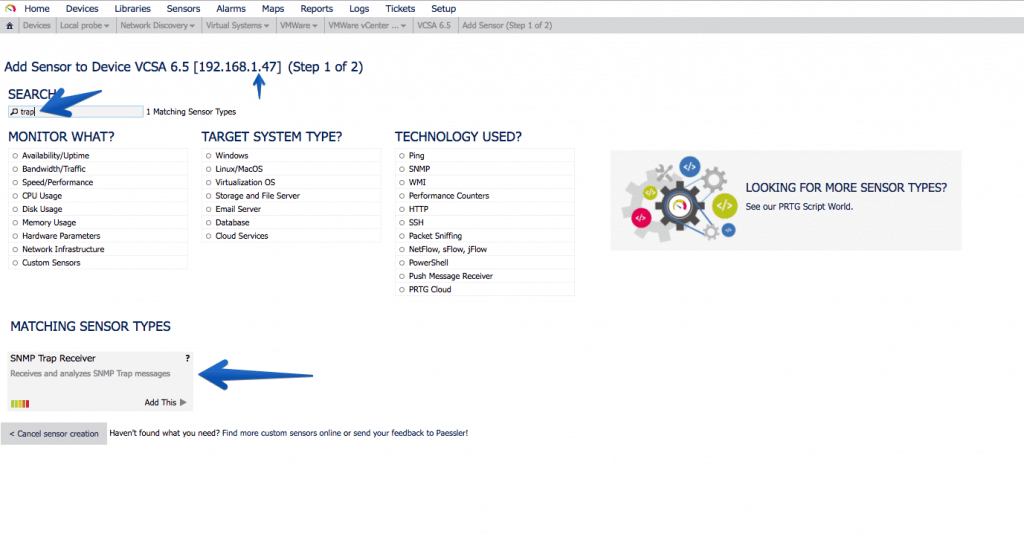
In PRTG it’s so simple how to add a new Sensor, search for Trap, and select the sensor called SNMP Trap Receiver:
 The configurations are not very complicated, and you just have to give Continue:
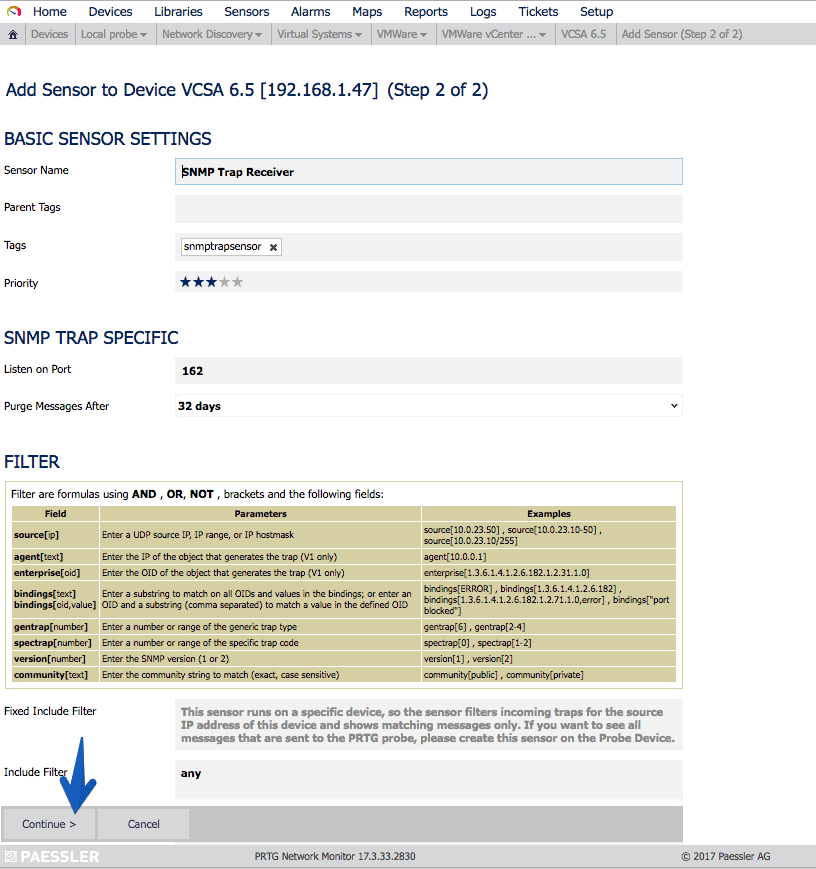 The sensor will show us the number of Errors and Warnings as we receive the traps of each type:
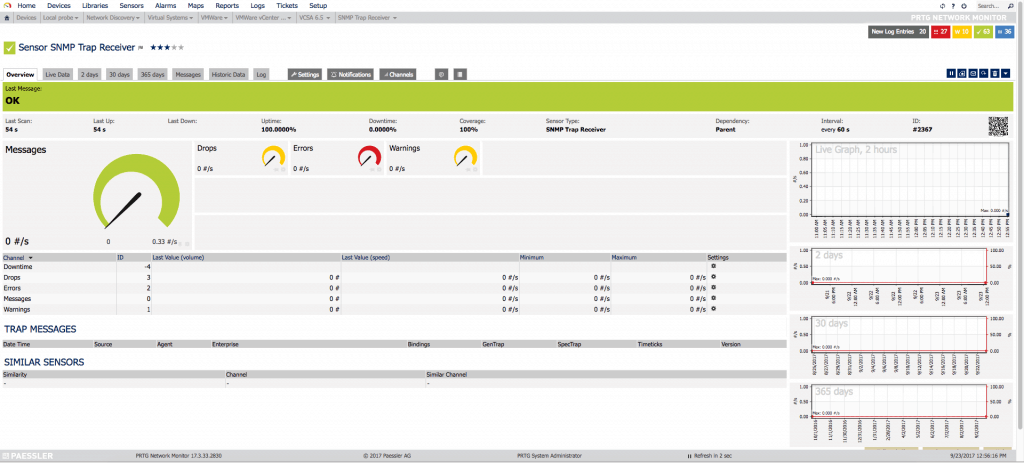
Creating the VCSA 6.5 Host in PRTG
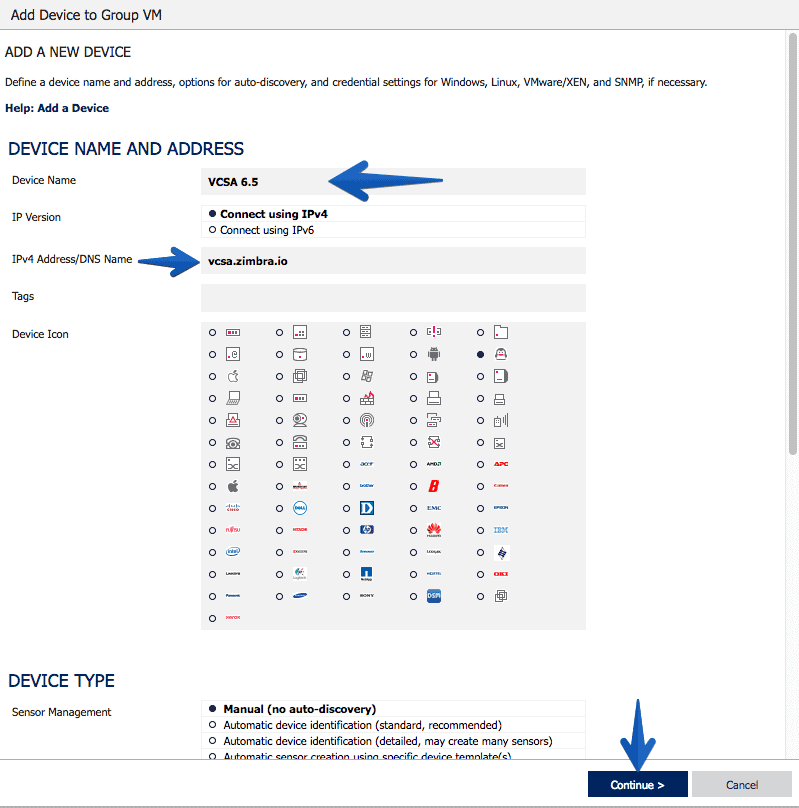
As always PRTG makes everything wonderfully simple, we will create a new Host, with the IP or hostname of our VCSA, an icon and press Continue, and that’s it:
Understanding what we can and want to monitor with SNMP in VCSA 6.5
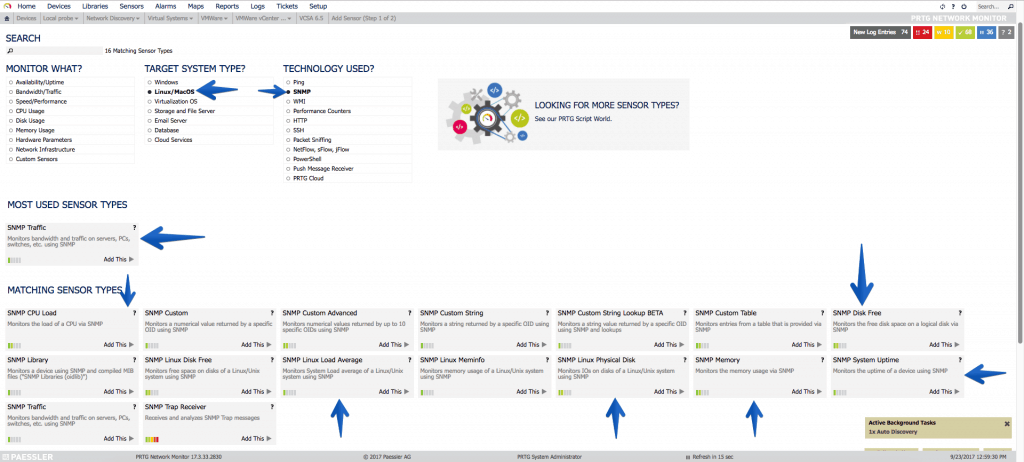
Fantastic, now that we have everything ready, we have to think about what we want to monitor in our VCSA, usually and as it is a Linux and SNMP environment, if we filter we get:
- That we can filter CPU, Disk Space, Network Traffic, Uptime, etc.
 Let’s start with the simple, with the interfaces of Network, in my case I have two interfaces since one is for HA, the so-called eth1. It’s always okay to monitor it and set an alarm when traffic alerts us, this will be that the HA process has been executed:
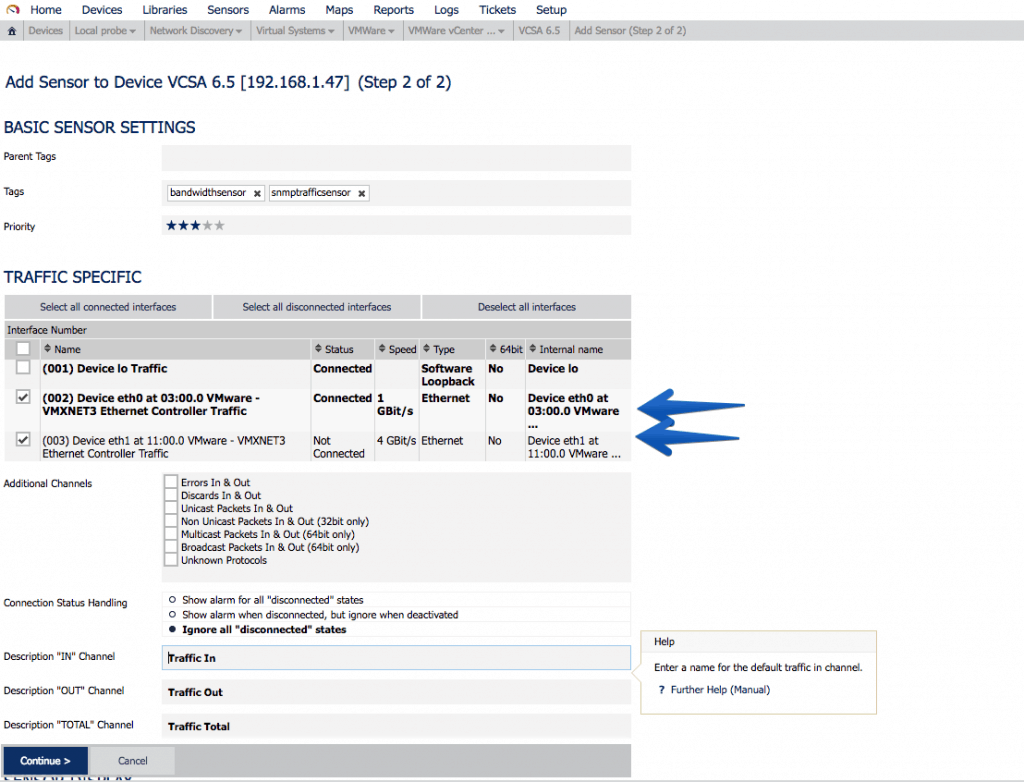 Another very interesting sensor is undoubtedly the SNMP disk sensor, where we can monitor all our mounting points, which as you know VCSA comes with a particular partitioning that I recommend to have watched:
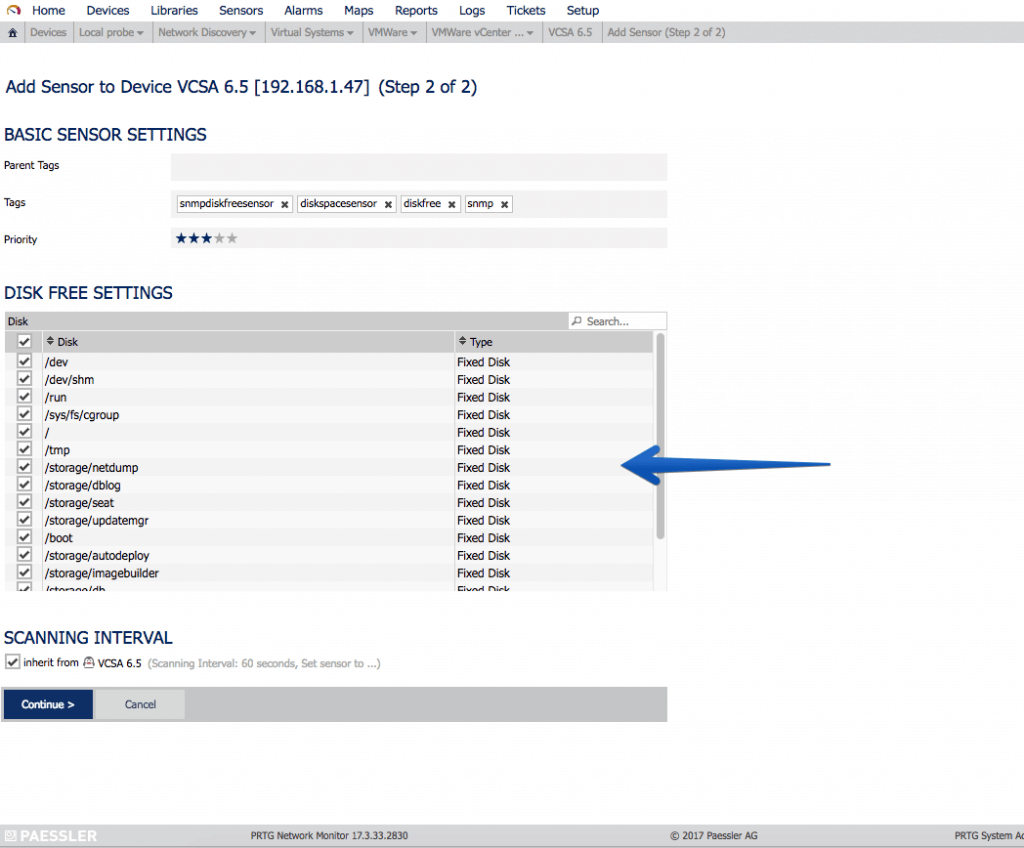 The always important Uptime to know how long since the VCSA’s on:
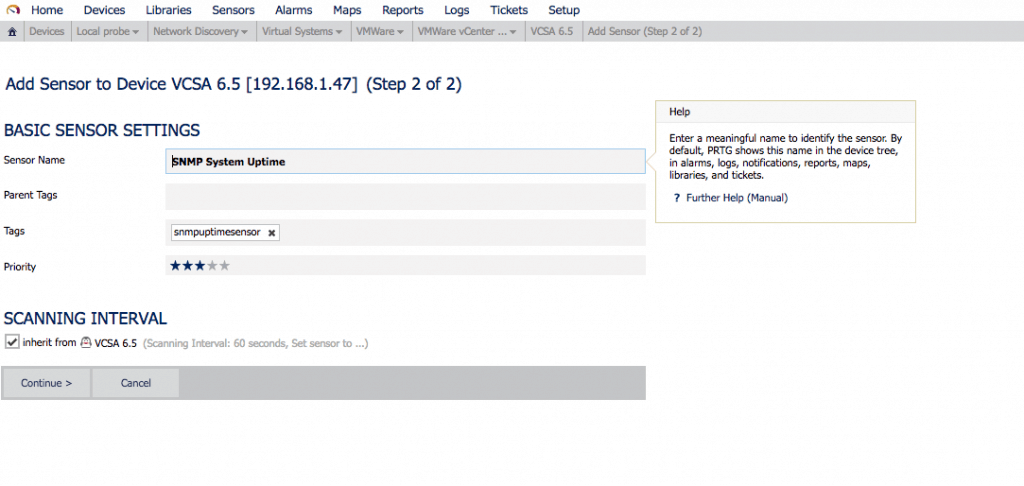 Let’s now use the custom MIBs we imported from VMware:
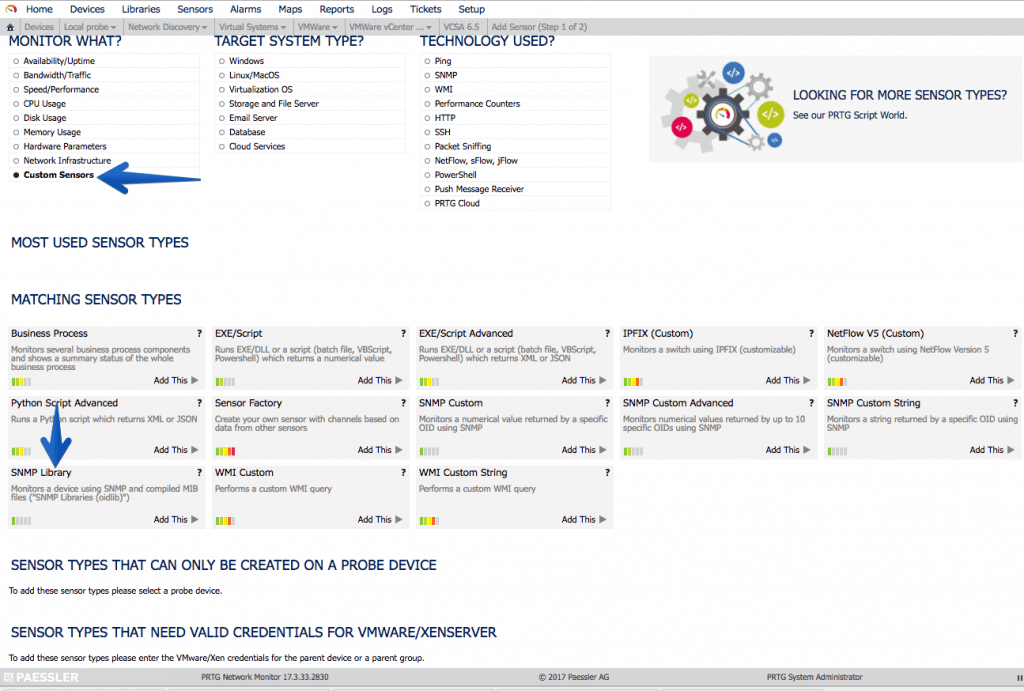 We’ll select our new VMware snmp oidlib:
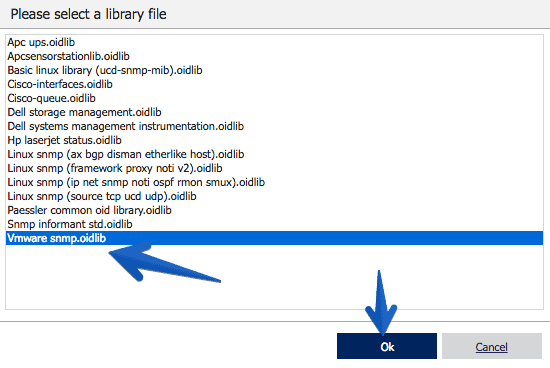 The process takes a few seconds:
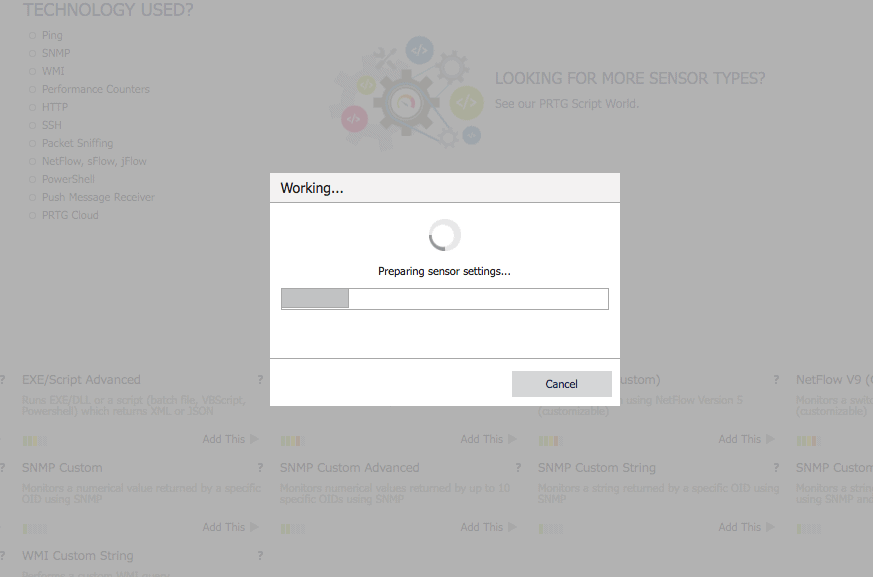 As you can see in the OID library I now have many new options, in this case I want to monitor the SNMPv2-MIB-system-sys-descr:
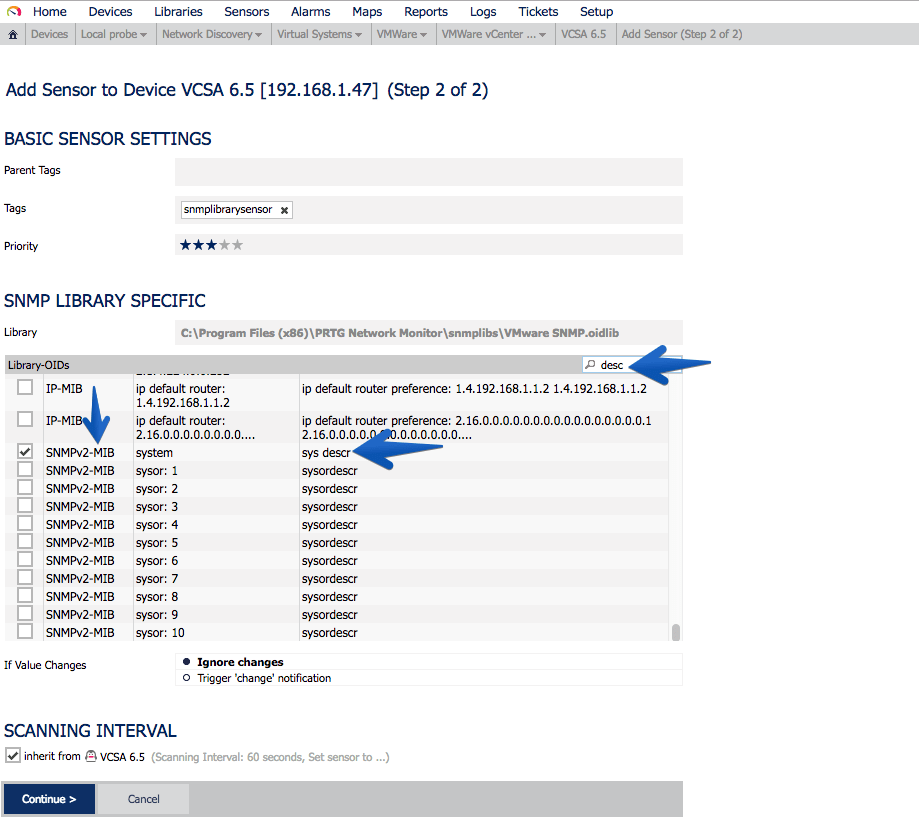 This sensor will remain in the following way, so that we can know the exact version that VCSA is running, without the need for Login, etc.
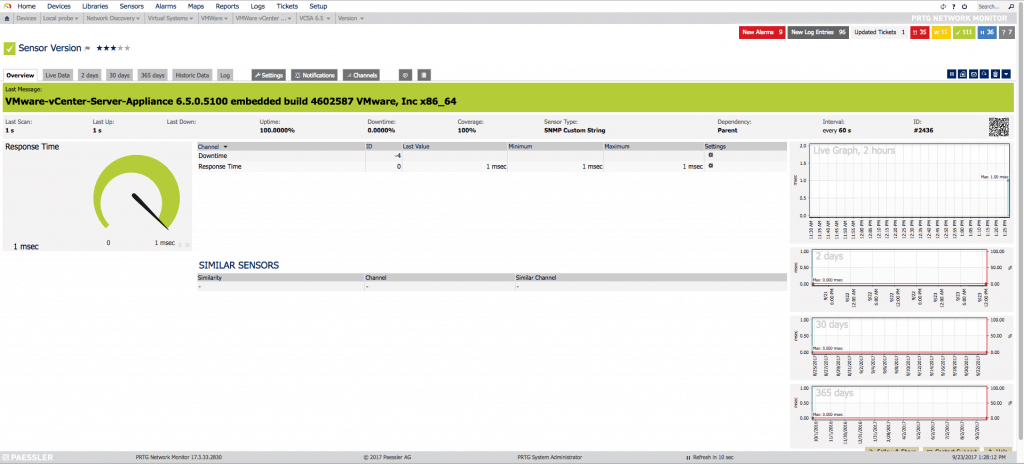 Another very important sensor is the processes that are running, to know if for any reason we have more or less processes running than usual:
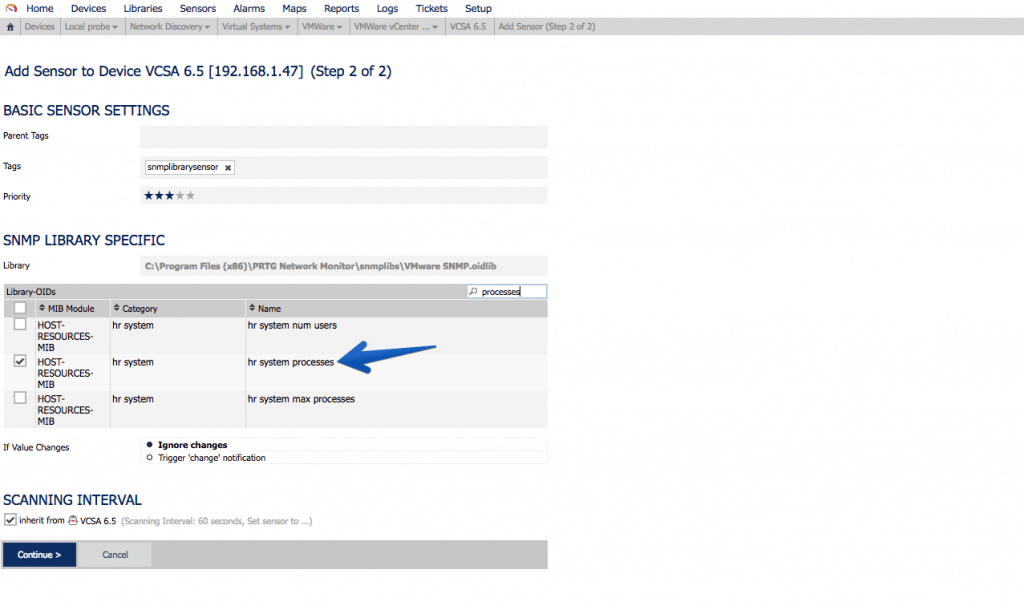 If we use the MIB called VMWARE-SYSTEM-MIB, we can extract in a granular way the product name, version and build, this of course is not limited to VCSA, if we were monitoring more components of VMware that allow SNMP, we can have everything monitored globally with PRTG.
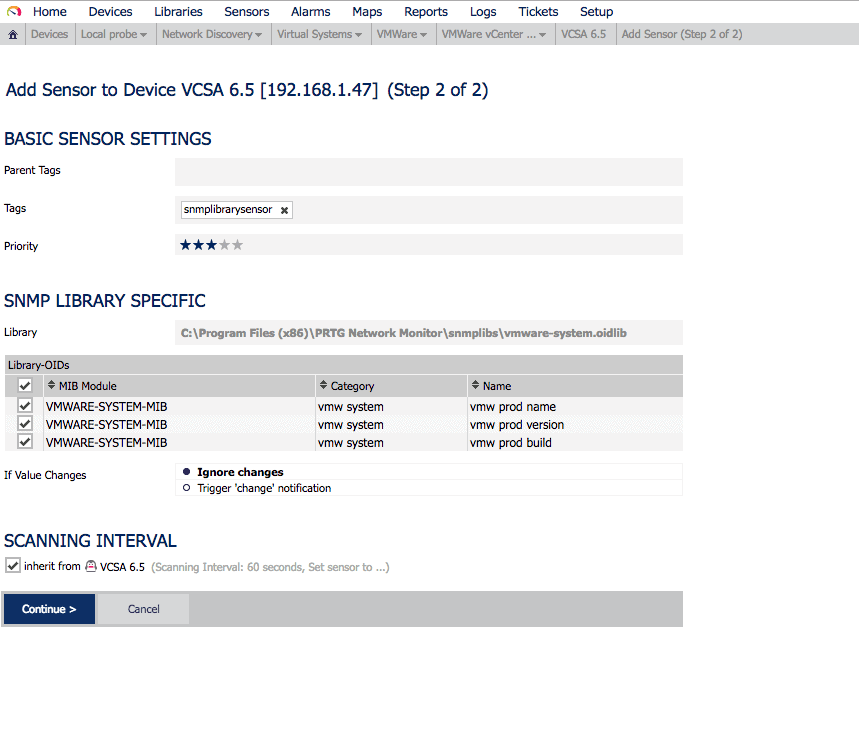 After a while of monitoring, seeing which sensors to add, which not, and so on, we’ll see our VCSA with all these sensors:
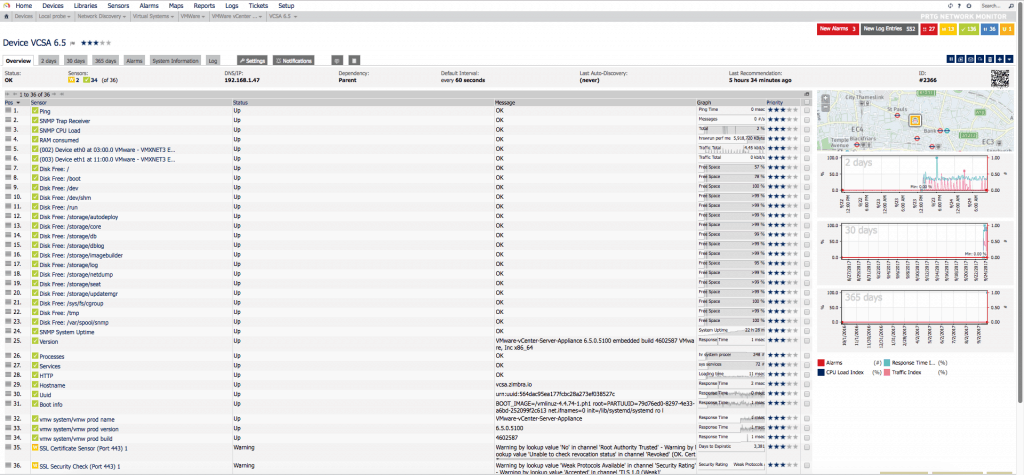 And if we work a little bit on the PRTG Map, we can get something as visual as this:This is perfect for having it on the NOC screens, or to introduce different customers.
There’s more information about SNMP here:
source: https://jorgedelacruz.uk/2017/09/27/vmware-how-to-monitor-your-vcsa-6-5-using-snmp-and-prtg-network-monitor/


