Integrate AKCP sensorProbe devices with Nagios® XI™ 5 to be alerted when temperature, humidity, or other environmental variables exceed specific thresholds.
In this example, we’ll demonstrate how to monitor AKCP Dual Temperature and Humidity Sensors connected to the AKCP sensorProbe platform. All of AKCP’s Intelligent Sensors connect using plug and play RJ45 connectors and can be monitored from Nagios using similar steps. For more information on other sensors please contact our support team.
Prerequisites for monitoring a sensorProbe device via SNMP Traps in Nagios XI 5
It is possible to monitor the AKCP sensorProbe actively OR passively within Nagios XI 5. This integration guide assumes that you have already set up your Nagios XI 5 system to receive SNMP traps. If you have not already configured Nagios to receive SNMP traps use the following guides provided by Nagios.
Step 1 : Download the AKCP MIB for use within Nagios XI
Monitoring a temperature sensor via SNMP requires an AKCP MIB definition file. The first step is to download and install the correct MIB file. You can download the AKCP MIB for monitoring temperature sensors via SNMP at the following link :
Once you have downloaded the AKCP MIB file for monitoring your temperature sensor, you need to unzip the archive and install the akcp.mib from the Nagios Web Interface.
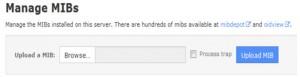
You can do this by navigating to Admin > System Extensions > Manage MIBs
Click on the Browse button and locate the akcp.mib
Select Process trap and then click Upload MIB.
To verify that your MIB file was processed correctly by Nagios XI, on your Nagios server check that the akcp.mib file is located in
/usr/share/snmp/mibs
Run the addmib command from the command line of your Nagios XI server as the root user. The command will look like :
addmib /usr/share/snmp/mibs/akcp.mib
Step 2 : Run the SNMP Wizard to set up Active Checks
The next step is to run the SNMP Wizard by navigating to the Configure > Run the Monitoring Wizardpage via the top navigation bar, and select SNMP Wizard.
In Step 2 enter the IP address for the AKCP sensor in the Device Address box and click Next.
![snmp-nagios-temperature-monitoring]()
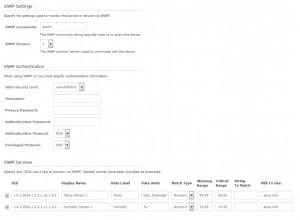
Step 3 requires you to enter a
SNMP Community string (it is not suggested to use the default of “public”) and also the
SNMP version. For this example we used version 1. The SNMP Authentication section does not apply to this set up because we are using SNMP v1.
The SNMP Authentication section does not apply to this set up because we are using SNMP v1.
Finally, you will need to enter information in to the SNMP Service section. Create a row for each sensor. For example the SNMP OID for the temperature sensor on RJ45#1 is:
1.3.6.1.4.1.3854.1.2.2.1.16.1.3.0
The SNMP OID for the humidity sensor on RJ45#1 is:
1.3.6.1.4.1.3854.1.2.2.1.17.1.3.0
If you added an additional sensor in the second port (#2) their OID would be very similar to the temperature and humidity sensors.
You will have to change the 0 (zero) at the end of the OID to 1 (one). These sensors would be added to the SNMP service section as:
1.3.6.1.4.1.3854.1.2.2.1.16.1.3.1
and
1.3.6.1.4.1.3854.1.2.2.1.17.1.3.1
![snmp-nagios-temperature-monitoring-2]()
Continue to fill in the remaining fields in the SNMP Service section. It is important to note the warning and critical values in this example are set up as ranges.
A critical alert occurs when the temperature is outside of the range 60-85 degrees. Finally, select the check boxes next to the temperature sensor and humidity sensor OIDs and click Next.
If you are willing to accept the default monitoring settings, you can click Finish. Otherwise continue to enter your preferences for monitoring these service checks through each step of the wizard and clickFinish.
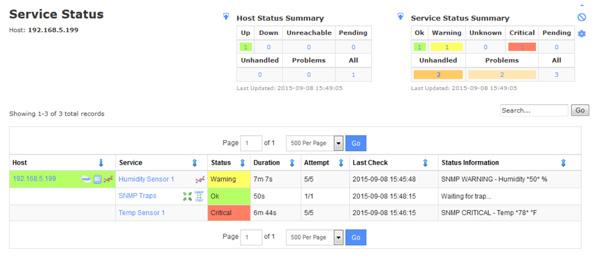
Once complete, you can navigate to Home > Services, and verify that your checks are working. The active checks are the Humidity Sensor 1 and Temperature Sensor 1 listed below.
Configuring The Dual Sensor To Send Passive Checks Via SNMP To Nagios XI
Sending Passive Checks to Nagios requires some set up on the AKCP sensorProbe2. To do this we need to log into the AKCP Web interface by entering the IP address in to your browser. The web interface will require you to enter your user account and password.
First you will want to set up your check thresholds on each sensor, and for this example we will set up the Temperature sensor on Port 1. Click on the Sensor tab, then under Environmental select Temperature, and finally select the Temperature sensor on port 1. From this screen enter your threshold information for critical events.
Next click on the Traps tab to enter pertinent information for sending SNMP traps to Nagios XI. Enter the IP of your Nagios server for the Destination IP. Next enter a community string. It is always a good idea to change the default community string from “public” to something else.
language translate For our example, we set the Send Keep Alive Traps to Off. Click on the
Save button and you are done with the set up required for the AKCP sensor.
Note: The AKCP sensorProbe2 allows you to send SNMP traps to two different destination IP addresses if needed.
Configuring Nagios XI To Receive Passive Checks Via The SNMP Trap Wizard
Once you have your Nagios server set up to receive SNMP Traps as outlined in the Prerequisite section, you will be able to set up Nagios XI to receive passive checks from the AKCP sensorProbe2.
To start, run the SNMP Trap Wizard by navigating to the Configure > Run the Monitoring Wizard page via the top navigation bar, and select SNMP Trap Wizard.
Click Next for Step 2. Then select the host you wish to enable SNMP traps for in Step 3 and click Next.
You can now select Finish if the default notifications options suit your needs, otherwise continue to set up notification and group options as you see fit.
You should now be able to see traps coming in from the Temperature and Humidity sensors. The passive check is listed below as the SNMP Traps check.
If for some reason you don’t see SNMP traps changing the status of your service check in Nagios XI, check your Unconfigured Objects page (accessed via Admin > Monitoring Config > Unconfigured Objects).
Also, reviewing the logs created by SNMPTT can help you troubleshoot the issue as well.
tail /var/log/snmptt/snmptt.log
tail /var/log/snmptt/snmpttunknown.log
tail /var/log/messages


 Step 3 requires you to enter a
 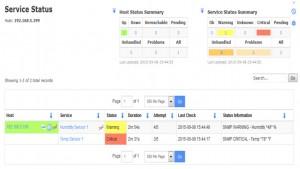 Continue to fill in the remaining fields in the SNMP Service section. It is important to note the warning and critical values in this example are set up as ranges.