Quantcast
Channel: BLOG DAYA CIPTA MANDIRI GROUP
Viewing all 2830 articles
Browse latest View live

Simple Secrets of Successful Knowledge Management

$
0
0

Simple Secrets of Successful Knowledge Management

A sound knowledge base eliminates the need to rediscover or reformulate knowledge.

Enterprise Solutions
March 6, 2017
Reprints
Knowledge that doesn’t serve is knowledge wasted. And for knowledge gained from experience and research to be useful, IT enterprises need to organize, manage, and offer it in the best way possible. Fortunately, the best way isn’t a Herculean task when you employ simple tricks to build a profound knowledge base (KB). A sound knowledge base eliminates the need to rediscover or reformulate knowledge and improves the support process. With that in mind, consider these best practices to help build a successful knowledge base.

Collect Information to Build Your KB

The most important part of knowledge management is building knowledge itself. The first step is to identify prospective areas from which knowledge can be derived and extract information. Resolutions on common issues can be used as templates if they are added to the KB as knowledge items. Converting tacit knowledge to explicit knowledge is essential for a successful knowledge management system, but the conversion requires collaborative efforts with careful investigation and input from experienced technicians. Also, to achieve a comprehensive KB, encourage your IT technicians to move resolutions directly to the KB. A good IT help desk application will allow the creation of knowledge articles right from ticket resolution. This significantly reduces the percentage of repeat incidents and keeps the KB up to date.

Categorize to Identify, Retrieve and Use Knowledge

Organizing and categorizing existing data can be challenging, especially when handling large KBs with wide scopes. However, it is important to group knowledge items and place them under relevant topics so that information is not lost in a pool of data. There are different ways in which you can organize knowledge, depending on what suits your organization best. Grouping can be based on document type, such as guidelines or bug fixes, or on the subject matter, such as hardware issues or software updates. Creating logical hierarchies is a method that will ease user navigation. The hierarchy should begin with broad topics and move on to categories and subcategories.

Implement a Knowledge Approval Process

Creating a well-structured piece of information that is relevant to the user is crucial. The quality of the content should be peer reviewed by subject matter experts for accuracy and relevance. Ultimately, information cannot be published as knowledge without a proper knowledge approval process. The content that is generated must go through peer review and be improved.
Along those lines, you can configure an automated approval workflow that prevents a solution from being published without peer approval. Create a unique knowledge manager role with permissions to approve solutions. Configuring an automatic trigger for notifications to approvers on submission of a solution will make the approval process easier. Approval processes eliminate ambiguity, making knowledge items more accurate and minimizing any reopening of closed tickets. For instance, there may be multiple solutions to troubleshoot a printer issue (network issue, hardware issue, etc.). However, the approval committee should be able to decide on the appropriate solution.

Choose Your Audience for Each Solution

Not every piece of information in the KB is relevant to all users. By choosing the right audience for a knowledge item, you can eliminate clutter in the endusers’ self-service portal. For technicians, create specific roles and groups based on their field of expertise and share only relevant topics. For example, finance documents are always confidential and therefore should be accessible only to related users. Along the same lines, documents on registry settings or swapping hardware parts are only relevant to IT experts in the field and can be restricted from endusers. However, make sure your technicians have full access to the KB, especially when the services are integrated in the help desk application.

Prompt Endusers Effectively with Relevant Knowledge Items

No matter how elaborate a KB is, it cannot be effective if it is out of reach. Making the KB easily accessible to endusers in the self-service portal will help them arrive at solutions without assistance from a technician, lowering the number of incidents. This can be done in the following ways.
  • When the enduser logs in to the application, the recently viewed or used solutions are listed.
  • When an enduser tries to log a ticket, relevant knowledge articles are suggested based on keywords.
  • In the self-service portal, endusers have easy access to the KB articles that have been made visible to them.
  • Relevant KB articles are automatically e-mailed to the enduser in response notifications (as auto suggestions) when the ticket is logged.
Likewise, the sooner an IT technician can get to a resolution in the KB, the easier it is to reduce the mean time to resolve incidents and improve first call resolution rates. This can be achieved by adding keywords and tags to solutions to make items easily searchable.

Widen the KB’S Horizon

A well-built KB should not be limited to storing resolutions for incidents. Use the KB as a repository of important checklists that keep a particular service up and running. Commonly used information such as checklists on regular server housekeeping tasks or changes that require restarting the server will keep technicians from missing crucial steps in change implementation. The KB should also be used to save important workflows in IT services, training material for technicians, user guides, and even FAQs. This, in turn, helps reduce incident response time and will help technicians keep up with pre-defined SLAs.

Establish a Knowledge Management Team

When it comes to creating a knowledge management (KM) system as a key resource in your organization, a knowledge management team certainly has its advantages. One of the most significant advantages is the added ownership and accountability in the KM process. You can create a user group of technicians who are well trained in the proposed KM model for your organization. This team should be assigned to supervise the approval process. They should also be able to streamline KM workflows, identify possible areas of extension, and be responsible for collecting information from resources. The whole KM process is cyclical, and the KM team should oversee it. This will help avoid chaotic roles and prevent any missed information.

Evaluate Your KB’s Performance

Constantly monitoring the efficiency of your KM system with relevant metrics will help you evaluate its performance. The following are the metrics and methodologies generally used in KM to identify its strengths and weaknesses:
  • Customer surveys on the quality and accessibility of the KB content
  • Identifying zero click-throughs where KM content exists
  • Evaluation of knowledge gaps (where KM content does not exist)
  • Reports from your help desk application on ticket response and resolution times, as well as reopen rates, show you the statistics required to improve your knowledge management system.
After you’ve built your knowledge base and have a good knowledge management system running, sit back and reap the benefits. Whether it’s just a few tweaks to an existing knowledge base or a brand new one, it shouldn’t be long before customers and employees say, “It’s on fleek!”
Did you enjoy this article? Click here to subscribe to Cloud Strategy Magazine. 

PRTG: How to Import VMware vSphere 6.5 MIBs Using MIB Importer and Converter

$
0
0

PRTG: How to Import VMware vSphere 6.5 MIBs Using MIB Importer and Converter

Regards, friends, in future entries on PRTG and VMware we will need additional libraries to monitor our VMware Infrastructures, so I use this input to explain how to import .mib files from VMware vSphere 6.5, although the process is similar for any other MIBs of others manufacturers.

Free download Paessler MIB Importer and Converter

The first thing we will have to do is download from the official PRTG website the tool:
I have decided to install the tool directly on the PRTG server, to save a few steps and make everything easier. Installation is a lifelong next-following:
We will select the path where we want to install the software:
We will leave the default options:
And the installation process takes a few seconds.

Download the new VMware vSphere 6.5 MIB

VMware puts at our disposal and for free all the MIB libraries we will need to monitor a VMware environment, we can download the .zip file from here:

Importing our VMware MIBs

Once we have the vSphere 6.5 MIB file and the installed tool, we will run the new icon on our desktop:
We will select File - Import MIB file
We could select all the files and save all of them in a single section, but we will surely have some errors:
Here are some errors, we can click on Cancel Import:
The import log will give us more information about properly imported OIDs from each MIB file, all those OIDs can be used later.
The last step is to click Save for PRTG Network Monitor to include these files in our PRTG.
The program already directly selects us the folder where we have the other oidlib, we will give a descriptive name:
My recommendation is to perform this process for each VMware MIB we want to use, one by one:
Log of the MIB file:
Another example of importing a single file:
We will have to restart the PRTG service to read the new oidlib files, from our PRTG console:

Creating a Custom Sensor Using Our New MIBs

Now that we have our new MIBs, we can create a custom sensor, using our SNMP libraries.
This will show us all the custom MIB libraries we can use:
This is all friends, in future entries we will see how to take advantage of this and monitor VMware.

Interesting Links

I would like to recommend these other posts about PRTG:

VMware: How to monitor your VCSA 6.5 using SNMP and PRTG Network Monitor

$
0
0

VMware: How to monitor your VCSA 6.5 using SNMP and PRTG Network Monitor

Greetings friends, as I have told you in previous posts, and surely you are seeing in all media, vCenter for Windows will be obsolete in the next version of VMware, which makes us start migrating to vCenter Server Appliance for Linux (VCSA 6.5).
The new VCSA 6.5 comes with many enhancements such as HA, Backup, and very basic web monitoring to see CPU and RAM, I leave you some interesting articles:
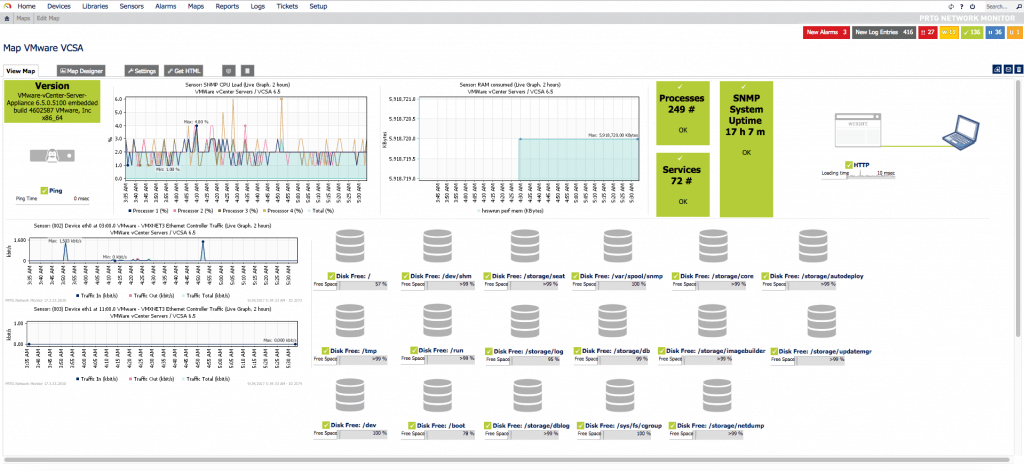
Without further delay, let’s start the article, at the end we can have a Dashboard similar to this one using the always recommended PRTG Network Monitor:

How to enable SNMP in VCSA 6.5

The first step is to activate SNMP in our VCSA 6.5, to do this we will log in through SSH, without entering the shell, we will launch the command snmp. get, to check the state of our SNMP:
We see that for now it is disabled with what we can go to the next step, which is to configure it and add the Hosts that we want to receive traps.
In the following command I’m going to configure SNMP in a basic way using the public community, at the same time I’m going to tell you that I want you to send me all the traps to the PRTG Host, and later on I want you to only send me the warning and error notifications.
There are four levels of logging for debug|info|warning|error traps (“debug” is the most detailed, and “error” the least detail). Come on, don’t forget the snmp. enable command to enable it:
If we launch the snmp. get command again now, we’ll see the result of our configuration:
We could also throw a test trap at our PRTG:
Now that we already have SNMP running, we could from a computer with VCSA’s IP access launch the following command that will give us back everything it’s showing by SNMP:
Algo así veremos si todo ha ido bien:
Something like this, we’ll see if everything went well.

Importing VMware MIBs into PRTG

This step is important, but fortunately for you, we already have the step-by-step in another blog post:

Configuring the Trap Sensor in PRTG

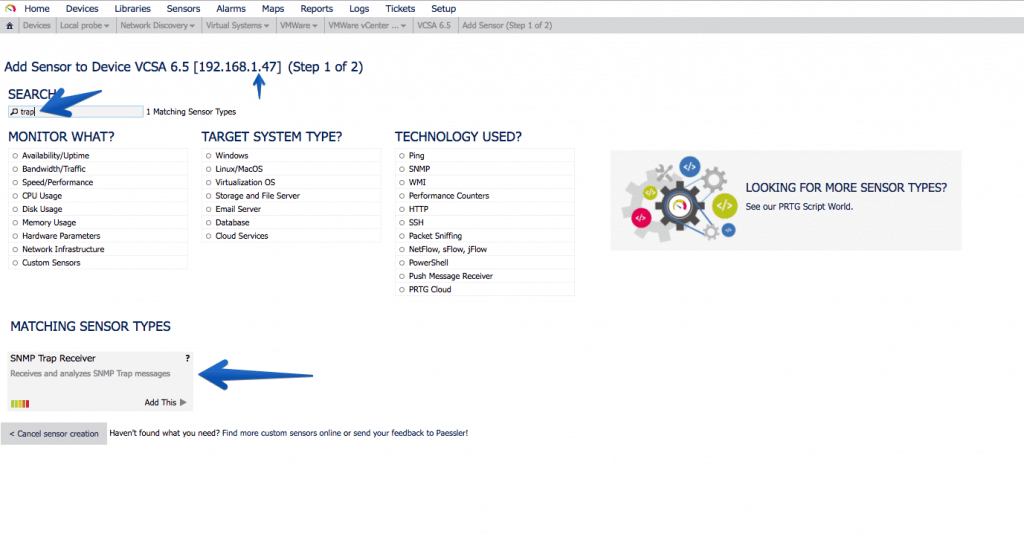
In PRTG it’s so simple how to add a new Sensor, search for Trap, and select the sensor called SNMP Trap Receiver:
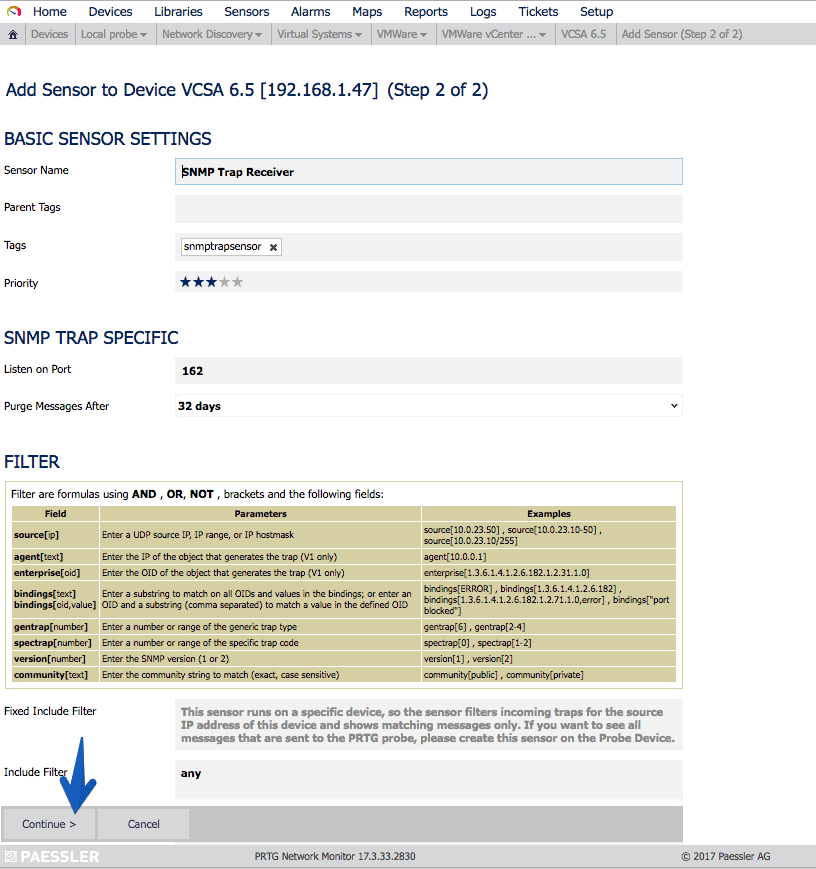
The configurations are not very complicated, and you just have to give Continue:
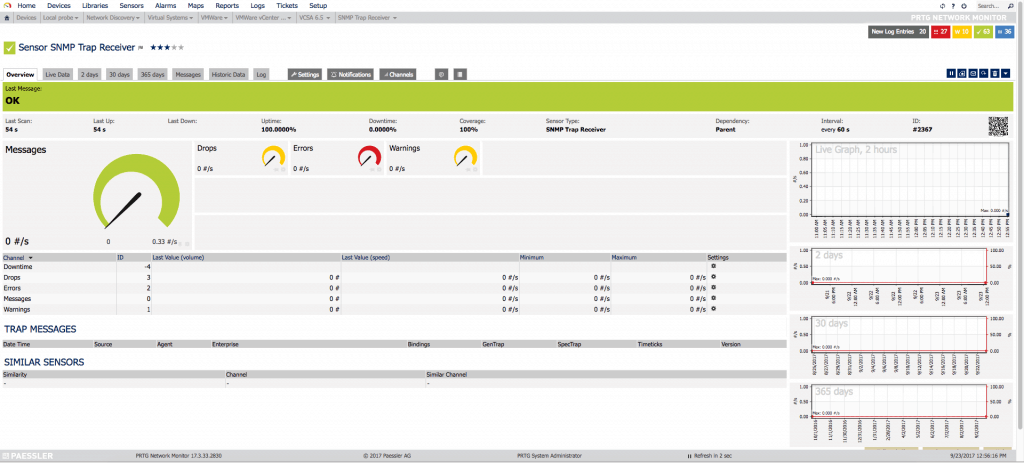
The sensor will show us the number of Errors and Warnings as we receive the traps of each type:

Creating the VCSA 6.5 Host in PRTG

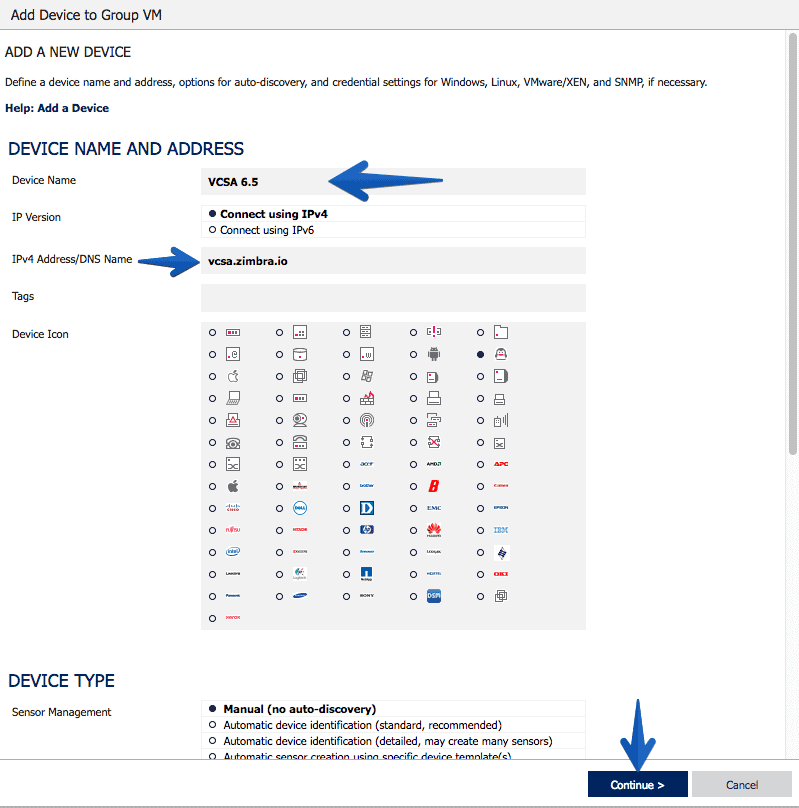
As always PRTG makes everything wonderfully simple, we will create a new Host, with the IP or hostname of our VCSA, an icon and press Continue, and that’s it:

Understanding what we can and want to monitor with SNMP in VCSA 6.5

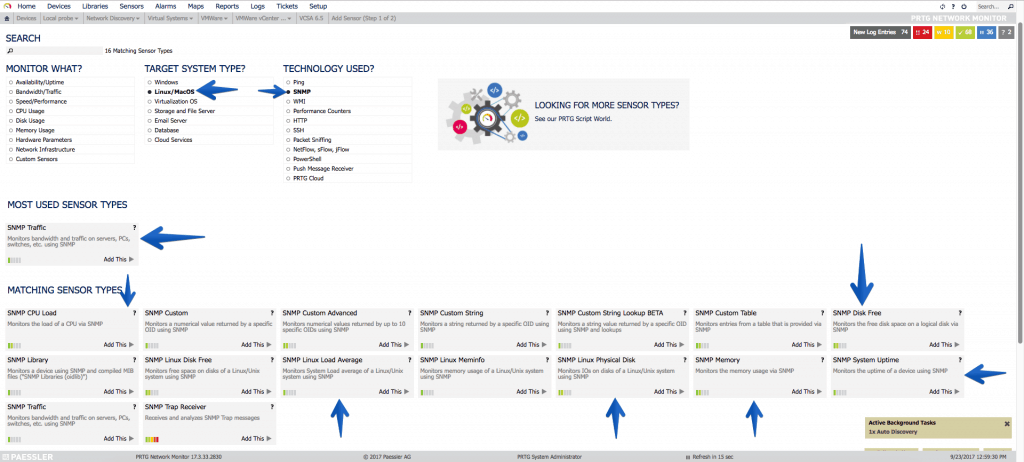
Fantastic, now that we have everything ready, we have to think about what we want to monitor in our VCSA, usually and as it is a Linux and SNMP environment, if we filter we get:
  • That we can filter CPU, Disk Space, Network Traffic, Uptime, etc.
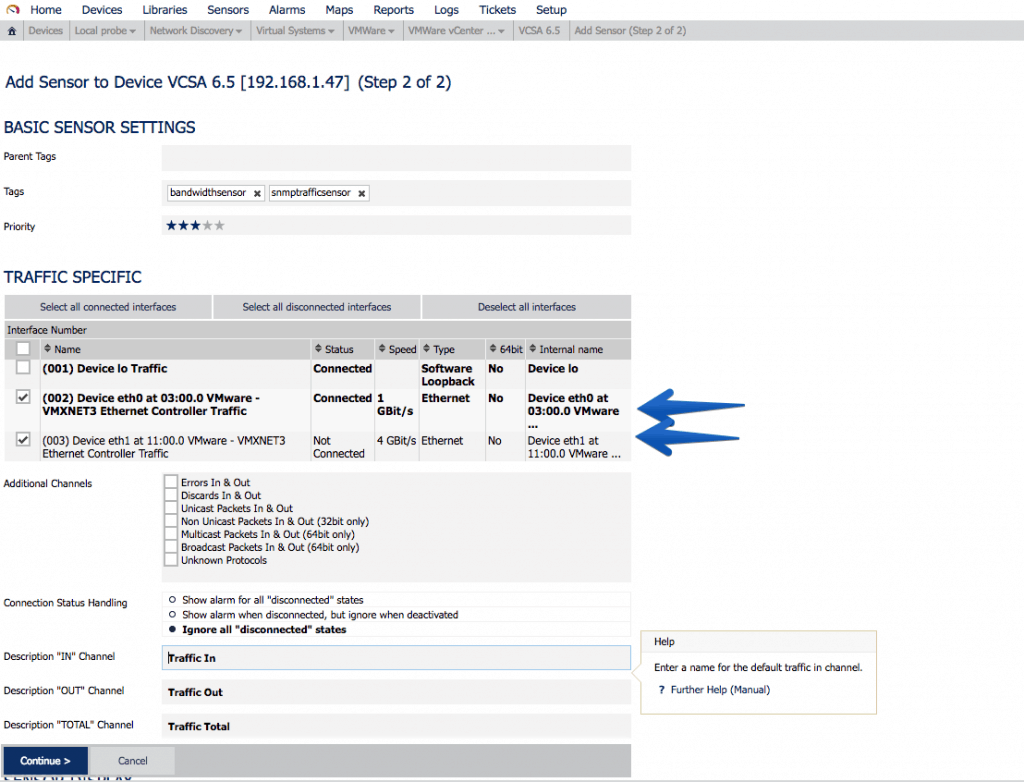
Let’s start with the simple, with the interfaces of Network, in my case I have two interfaces since one is for HA, the so-called eth1. It’s always okay to monitor it and set an alarm when traffic alerts us, this will be that the HA process has been executed:
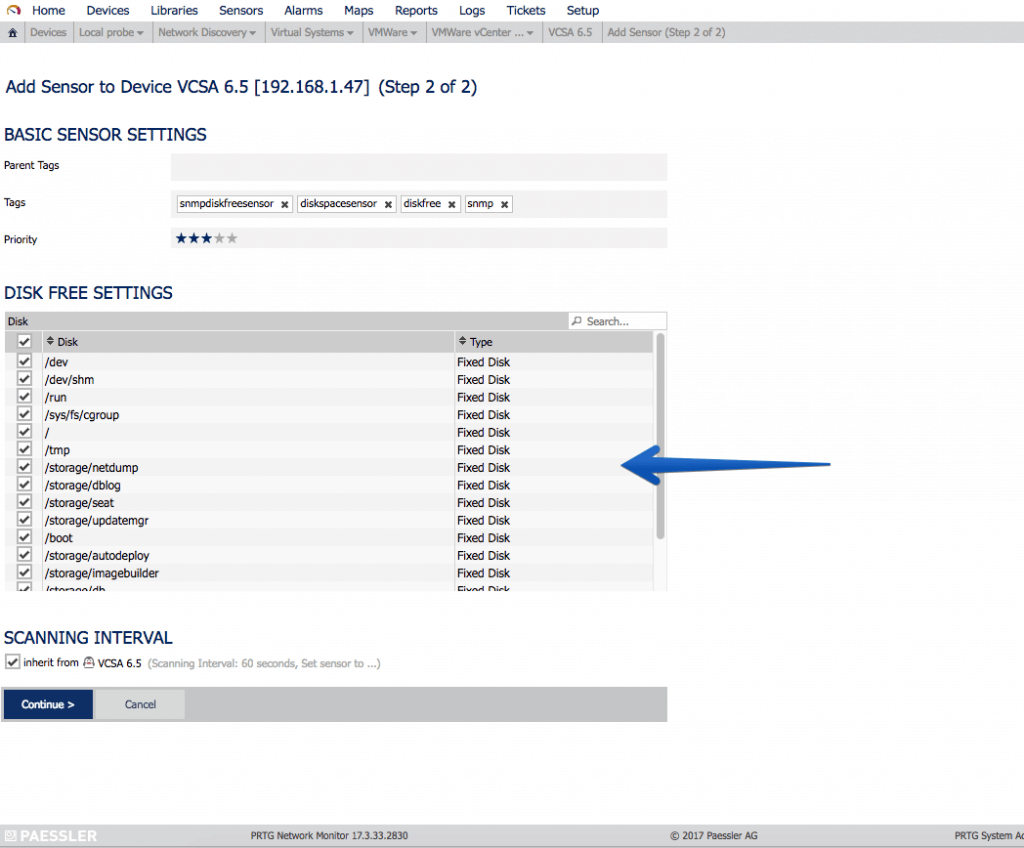
Another very interesting sensor is undoubtedly the SNMP disk sensor, where we can monitor all our mounting points, which as you know VCSA comes with a particular partitioning that I recommend to have watched:
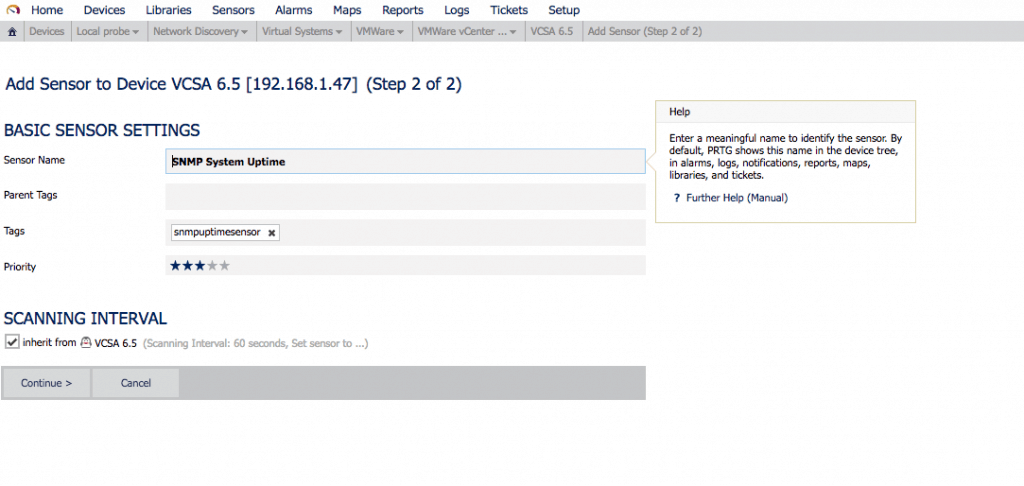
The always important Uptime to know how long since the VCSA’s on:
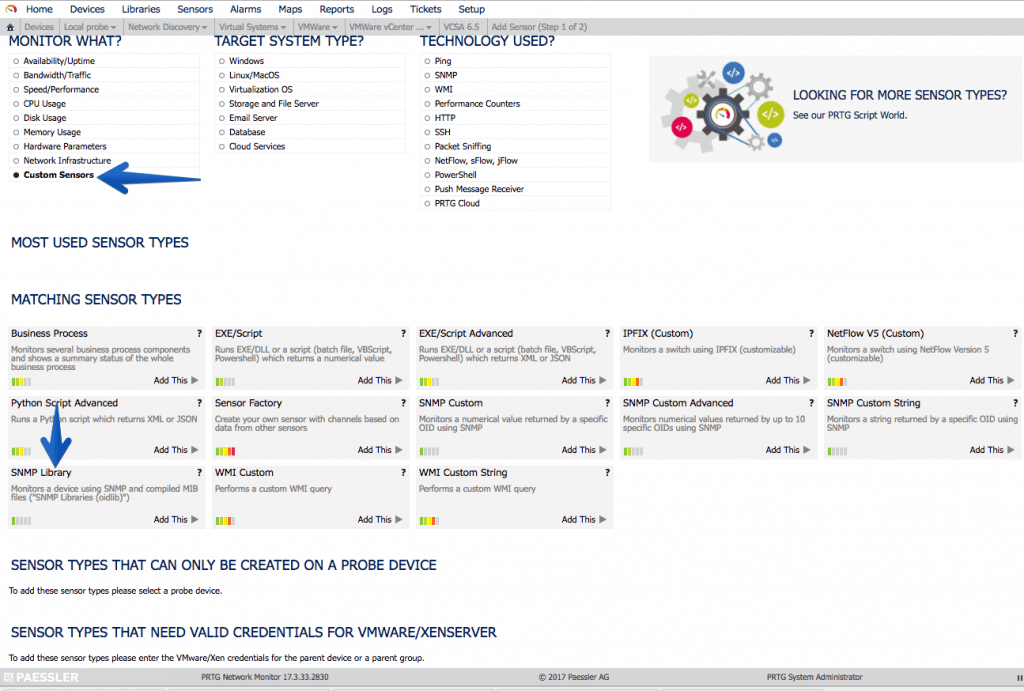
Let’s now use the custom MIBs we imported from VMware:
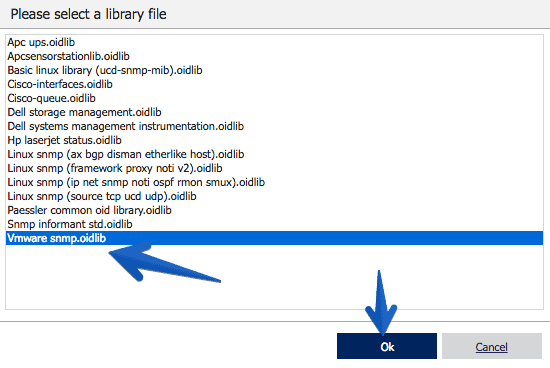
We’ll select our new VMware snmp oidlib:
The process takes a few seconds:
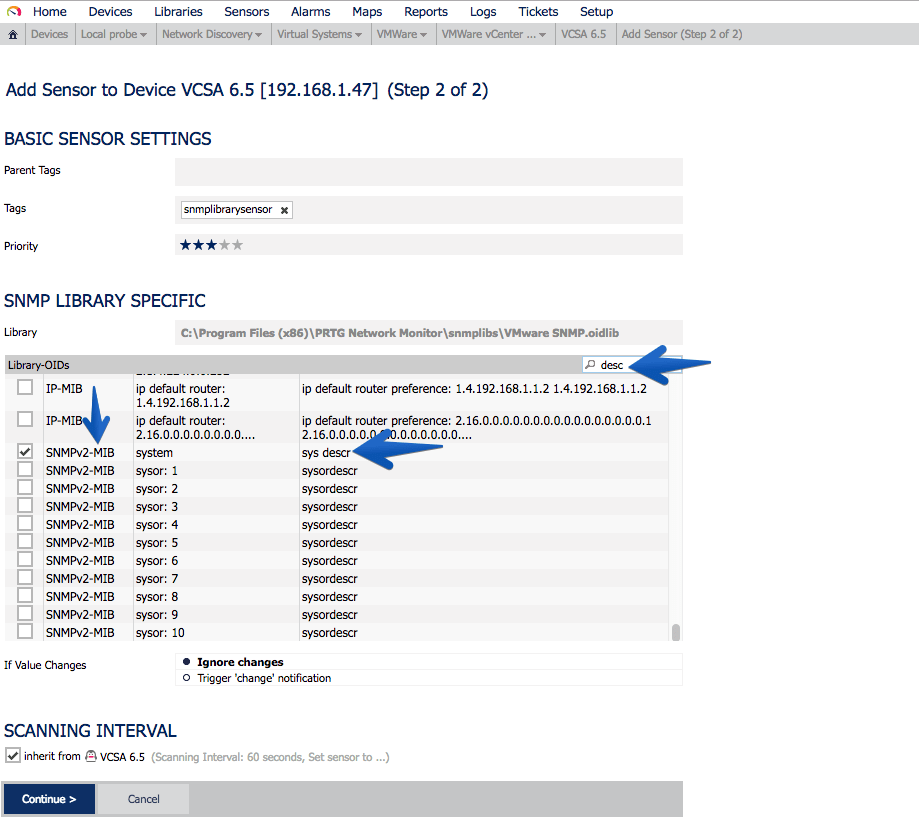
As you can see in the OID library I now have many new options, in this case I want to monitor the SNMPv2-MIB-system-sys-descr:
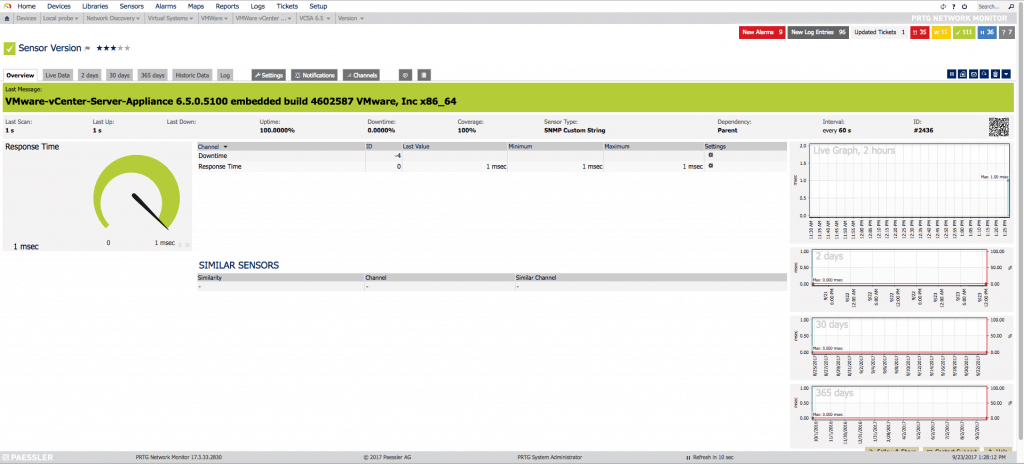
This sensor will remain in the following way, so that we can know the exact version that VCSA is running, without the need for Login, etc.
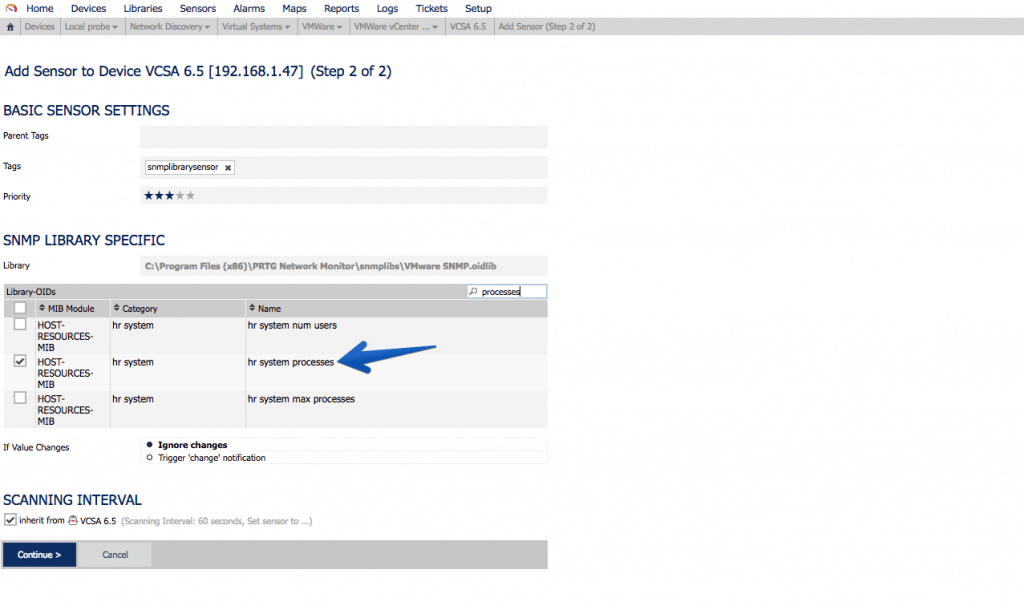
Another very important sensor is the processes that are running, to know if for any reason we have more or less processes running than usual:
If we use the MIB called VMWARE-SYSTEM-MIB, we can extract in a granular way the product name, version and build, this of course is not limited to VCSA, if we were monitoring more components of VMware that allow SNMP, we can have everything monitored globally with PRTG.
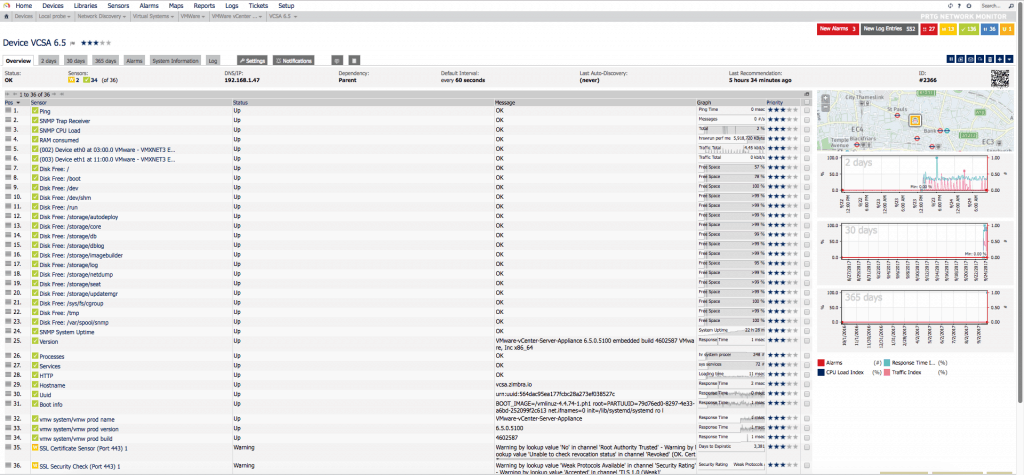
After a while of monitoring, seeing which sensors to add, which not, and so on, we’ll see our VCSA with all these sensors:
And if we work a little bit on the PRTG Map, we can get something as visual as this:
This is perfect for having it on the NOC screens, or to introduce different customers.
There’s more information about SNMP here:
source: https://jorgedelacruz.uk/2017/09/27/vmware-how-to-monitor-your-vcsa-6-5-using-snmp-and-prtg-network-monitor/

ALWAYS START FROM YOUR CUSTOMER's PERSPECTIVE

$
0
0
ALWAYS START FROM YOUR CUSTOMER's PERSPECTIVE

Pada tahun 1980, tiga orang engineer di Amerika bernama Ben Bertiger, Raymond Leopold dan Ken Peterson mengembangkan sebuah system telekomunikasi ampuh yang akan membuat semua manusia di permukaan bumi bisa saling menghubungi dengan mudah menggunakan jaringan satelit. Mereka menghitung bahwa jumlah satelit yang dibutuhkan ternyata ada 77 (untuk mengcover seluruh permukaan bumi). Maka mereka menamakan system ini Iridium (sesuai dengan nama unsur ke 77 di tabel periodik kimia). Ide brilliant, dan maka para investor pun menyetorkan ratusan juta dolar modal. Akhirnya sistem ini dilaunching dengan heboh , bahkan oleh president USA pada waktu itu.
Beberapa tahun kemudian, Ternyata .....
- system nya kurang bisa diandalkan
- call menggunakan jaringan ini sangat lelet
- beberapa area susah dicover
- harga handset dan call nya sangat mahal

Dan para investor Iridium pun menelan pil pahit. Iridium dinyatakan bangkrut. Begitulah kadang kadang kalau para enterpreneur punya ide yang (secara teknis) bagus, tetapi tidak berfikir secara  bisnis. Dan banyak contoh lain dari product product technology yang kelihatannya bagus banget secara teknis, para enterpreneur itu akan dengan bangganya memamerkan kepada teman-temannya, kepada investor, bahkan di depan panggung besar pameran teknology. Tetapi kemudian pada saat diluncurkan ternyata hanya  bisa menghabiskan modal para investor, dan customer tidak ternyata tidak tertarik dengan productnya.

Kita dengar cerita Jeff Bezos, dia adalah seorang Insinyur Elektro juga (lulusan dari Princeton University).

Setelah lulus dari kuliah, dia tidak buru-buru menjadi enterpreneur (hahahaha, memangnya di Indonesia, belum punya skills, sudah bermimpi mau jadi enterpreneur? ).
Anyway, Jeff berfikir bahwa setelah lulus teknik, sebaiknya dia bekerja dulu menjadi investment banker di sebuah bank besar di Wall Street.
Tidak tanggung-tanggung, 8 tahun dia  bekerja di  bank itu.
Tentunya bekal 8 tahun sebagai seorang investment banker semakin memperkaya kompetensinya, dan menambah mantap systematic thinking yang dia pelajari sewaktu kuliah di Electro.

Akhirnya dia pun bermimpi membuat sebuah bisnis yang baru berbasis teknology.
Dan kemudian dia pun berfikir dengan urut-urutan seperti ini:
- bisnis apa yang akan dibutuhkan dan disukai customer?
- bisnis apa yang akan mendatangkan profit secara long term?
- bisnis apa yang secara teknology bisa direalisasikan?

Lihat kan bagaimana urutan pemikiran Jeff? Sementara insinyur lain (yang tidak pernah belajar bisnis) akan berfikir secara teknologi dulu, kemudian profit, dan banyak yang tidak pernah memikirkan customer 😁

Dari pemikiran itu, Jeff berfikir bahwa Internet akan mengalami booming, tetapi  Jeff tidak terburu buru langsung membuat product canggih dengan berbasis Internet.
Jeff berfikir kira-kira product apa yang berpotensi untuk membuat customernya bilang "WOW" karena sangat kagum.
Akhirnya Jeff melihat potensi pada pembuatan toko buku.
Customer pasti akan kagum kalau mereka mempunyai pilihan dari jutaan buku (saat ini Amazon menjual 12 juta buku), dan customer pasti akan lebih suka lagi kalau hanya dengan beberapa "click" di computer mereka, buku itu akan tiba di rumah keesokan harinya.
Dan Jeff pun bekerja keras untuk membuat toko buku On Line yang paling sukses di dunia (Amazon).
That's because dia mulai berfikir dengan apa yang dibutuhkan customer.
Bukan memulai dengan "apa yang saya punya" dan bagaimana menjualnya ke customer!

Sementara insinyur-insinyur yang mendesain Iridium memulai dengan, saya punya sistem telekomunikasi yang canggih, bagaimana saya bisa menjualnya ke orang lain?

I am sure by now you understand the message:

- Always start fron your customer's perspective
- Think how you can make it a long term success
- Develop a product that will make your customer say "WOW"

Padahal seringkali kita merasa bahwa kita lagi "merasa" punya product yang hebat dan keren, terus bagaimana dong? Kita lupakan saja? Kita gak launch ke customer? Ya jangan, sayang kan? Siapa tahu your product will become the  next "Amazon"

It is always great to have a good product.
Hanya saja, sebelum launching ke market, make sure you follow these steps ....


1. Understand the relevancy and the differentiators of your products

Pastikan bahwa product anda memang relevan saat ini dan memang dibutuhkan pelanggan anda.
Tentu nya saat ini di market sudah ada product yang sejenis dengan yang anda punya, atau at least bisa menjadi pengganti product anda saat ini, pastikan  bahwa product anda mempunyai "differentiators" yang akan membuat pelanggan anda "switch" dari product yang biasa mereka gunakan selama ini.

2. Don't get excited yet, but change your perspective, from your customer's point of view

Sekarang anda berganti posisi dan menjadi pelanggan anda. Be the "devil advocate for yourself".
Tanyakan kepada anda sendiri (sebagai customer), apakah product anda cukup menarik, menjawab kebutuhan anda dan anda memang akan bersedia berpindah dari product atau service yang selama ini anda gunakan.
Dalam kasusnya Amazon, tentu saja customer akan bersedia membeli dari Amazon dan tidak lagi pergi ke toko buku karena beli di Amazon lebih praktis, menghemat waktu anda dan anda punya lebih banyak pilihan (Gak mungkin ada toko buku yang akan punya stock 12 juta buku seperti Amazon),
Dan dengan ketiga keuntungan tersebut (praktis, waktu, pilihan), akhirnya memang banyak yang berpindah dari toko buku tradisional ke Amazon.
Dan akhirnya memang banyak toko buku di Eropa dan Amerika to pun tutup! 

3. Think, how can you make your customers say "WOW"

Anda suka makan kue coklat? Saya juga! Dan kue coklat yang enak memerlukan kue cherry merah di atasnya sebagai pelengkap. Agar yang makan kue bisa bilang "WOW" dengan penuh kekaguman.
Product dan jasa anda juga demikian. Mestinya anda tidak puas dengan fungsional aspek yang berjalan lancar. Anda memerlukan WOW effect, sesuatu yang tadinya tidak diharapkan customer anda, tapi kemudian membuat customer anda kagum, dan langsung berpindah dari competitor anda ke anda.

Dalam kasusnya Amazon, wow effectnya (selain bahwa membeli buku bisa lebih "praktis", menghemat waktu dan punya banyak pilihan), adalah juga fakta bahwa dengan hanya beberapa click di computer anda, buku itu akan datang keesokan harinya. WOW!
Pertanyaan saya ke anda, apakah "WOw" effect yang anda tawarkan?

4. Communicate consistent message to your customers and your employees

Sekarang, anda sudah jelas tentang apa saja yang menjadi differentiators anda.
Pada saat ini mestinya anda bisa menjawab 3 pertanyaan ini...
- Kenapa product anda relevant? 
- Apa yang menjadi differentiator anda? (mengapa customer anda akan switch dari product lain ke anda)
- Apa yanv menjadi wow factor anda? (Apa yang akan membuat customer anda kagum, dan kalau perlu, akan membayar bahkan lebih mahal daripada product lainnya?)

Jawaban dari pertanyaan itu harus dikemas dalam message yang consisten dan anda kirimkan ke semua orang, baik itu di dalam perusahaan (seluruh karyawan anda) maupun keluar (seluruh partner, supplier dan customer anda).

5. Combine your "wow" product with "great" experiences

Anda sudah punya great product, anda sudah mengerti differentator dan wow effectnya.
Terakhir, anda harus make sure bahwa customer juga mempunyai great experience.
Dari segi kemudahan pemakaian, kenyamanan, dan segala aspeknya termasuk service dan support bilamana diperlukan.
In the end of the day your customer will care about the total end to end experience of using your products.

Ingat, sebelum anda launcing product anda (yang berbasis teknologi), yakinjab anda sudah mengecek kelima hal di bawah ini ...
1. Understand the differentiators and the relevancy of your products
2. Don't get excited yet, but change your perspective, from your customer's point of view
3. Think, how can you make your customers say "WOW"
4. Communicate consistent message to your customers and your employees
5. Combine your "wow" product with "great" experiences


Salam Hangat,

Pambudi Sunarsihanto

Fanky Christian
mobile: 08121057533
fankychristian.blogspot.com

Indonesia’s ICT spending to hit US$29.5bil in 2020: IDC

$
0
0

Indonesia’s ICT spending to hit US$29.5bil in 2020: IDC

By Masyitha Baziad | Jan 20, 2017
  • Majority of the country’s IT spending still goes to devices
  • IT spending alone will reach US$11.9 billion in 2020


US-BASED research firm International Data Corporation (IDC) Indonesia reported that the country’s information and communication technology (ICT) spending will increase 16% to Rp394 trillion (US$29.5 billion) in 2020, from the 2017’s prediction of Rp339 trillion (US$25.4 billion).
The information technology (IT) spending alone, excluding communication spending will reach Rp159 trillion (US$11.9 billion) in 2020, increase 24.2% from the 2017’s prediction of Rp128 trillion (US$9.6 billion).           
The majority of the country’s IT spending goes to devices, such as smartphones, PCs, and tablets, which will reach Rp106 trillion (US$7.9 billion) in 2020, a 15.2% increase from an estimated Rp92 trillion (US$6.9 billion) in 2017.
“Indonesia’s IT spending is always driven by consumers rather than enterprise. The split is always about 57% to 58% for consumer IT spending against 42% to 43% for enterprise, simply because the consumer market is big, and people are buying more devices,” said IDC Indonesia’s consulting research manager, Mevira Munindra (pic, above).
However she said the growth of consumer IT spending in the next three years will slow down to single digits, with a compound annual growth rate (CAGR) of 6.96%.
While hardware and devices will still dominate Indonesia’s IT spending, the research firm also sees a change in the behaviour of companies across the country that will make IT services become one of the main components of growth in 2020.
“So far, devices is still the biggest contributor to Indonesia’s IT spending. However we are seeing more and more companies in Indonesia embracing emerging technologies such as cloud, analytics, managed services, data centre management that are provided by tech vendors,”
She noted that IT services spending will increase 61.1% in 2020 to Rp29 trillion (US$2.2 billion) from the estimated of Rp18 trillion (US$1.3 billion) in 2017.
“Digital transformation awareness is increasing, especially as the end-user is now starting to demand more efficient and high-quality service, as well as the heightened competition created by many startup players,
“Companies really need to step up their game, innovate, and ensure that they can still be relevant in the digital business era. Without utilising IT and technology, there is no way they can survive,” she added.
Another driver for Indonesia’s IT spending is software. Thanks to the blossoming application industry in the country, software spending will increase 33% to Rp12 trillion (US$896.7 million) in 2020, from the estimated Rp9 trillion (US$672.5 million) in 2017.
Top three verticals in IT spending
From all the industries and verticals in the country, retail, banking, financial services and insurance (BFSI), and manufacturing come up as the top three verticals for IT spending, each with 20.37%, 7.49% and 4.62% CAGR respectively.
“The story here is because these three verticals faced the most disruption, especially in the past two years; all retailers now are going online because of e-commerce pressure, BFSI are innovating or working together with startups, and manufacturing needs to increase productivity and maintain costs,” Mevira explained.
Digital transformation investment in the retail industry is seen to double by 2019, as 66% of Indonesian retailers believe that digital transformation will help them compete in the hyper-digital era. Retail leaders want to increase their competitive advantage by moving towards online platforms.
“Indonesian retailers are expected to move capital way from physical stores to better manage their online presence, and to automate their back-end processes for better customer experience and inventory management,” she added.
For BFSI, the digital transformation story is dominated with migration to cloud, with IDC Indonesia seeing 85% of Indonesian financial institutions making this move.
“Most Indonesian banks, around 70% of them, are looking at cloud as a way to alleviate infrastructure costs in the next three years,” she said.
In the manufacturing industry, even though the pressure is high especially for labour-intensive manufacturing, more than 75% of the country’s manufacturers have no aspirations to change digitally.
“Those who have done so mostly are multinational companies who have implemented transformation programmes on a global level. This has resulted in a major setback for the industry’s digital transformation agenda in Indonesia,” Mevira warned.
According to IDC, the pressure has forced around 10 manufacturers including General Electric, Panasonic, and Ford to close down operations in the country.
“If you look at major industries and verticals in Indonesia right now, none of them are really growing at a level that will impact the macroeconomic condition in a big way. The country needs a new catalyst for economic growth, and believe it or not, it comes from the ICT,” IDC Indonesia’s country manager Sudev Bangah added.
“When companies and the government start putting their attention on ICT, it can boost companies’ growth, and when companies are growing the industry will grow. This will impact the growth of gross domestic product (GDP) in the long run; we are talking about sustainability,” he added.
IDC Indonesia also has revealed its top 10 predictions for ICT in Indonesia, including a few points already mentioned above:
  1. By 2019, 50% of IT companies will create new customer-facing and ecosystem-facing services to meet business digital transformation needs.
  2. By 2018, the lack of vision, credibility, or ability to influence will keep 80% of IT executives from attaining leadership roles in enterprise digital transformation.
  3. By 2020, Indonesian firms will use open innovation to allocate expertise to 15% of new projects, aiming to increase their new product introduction success rates by over 50%.
  4. By 2020, nearly 20% of operational processes will be self-healing and self-learning, minimising the need for human intervention or adjustments.
  5. By 2018, online brand ambassadors and social media influencers will have more marketing power
  6. By 2019, retail’s digital transformation investments will double, drawing funds away from store capital and profoundly changing the retail industry.
  7. By 2019, only 30% of manufacturers investing in digital transformation will be able to maximize the outcome, while outdated business models and technology hold the rest back.
  8. By 2019, cloud adoption will reduce infrastructure spend by 25% among top-tier banks.
  9. By 2019, 20% of local and regional governments will use Internet of Things (IoT) to turn infrastructure like roads, street lights, and traffic signals into assets instead of liabilities.
  10. By 2017, 90% of Indonesian cities will fail to take full advantage of smart city data and digital assets due to a lack of processes, project management, and change management skills.
Sudev added that companies should use 2017 as an opportunity to fully unlock their digital economy potential by eliminating archaic thinking and pushing forward with an innovation agenda.
“It really depends on what the country and companies do this year that will determine whether Indonesia will be a digital explorer or digital player in 2020,” Mevira concluded.
source: https://www.digitalnewsasia.com/digital-economy/indonesia%E2%80%99s-ict-spending-hit-us295bil-2020-idc

Menantikan tampilan baru PRTG

$
0
0

Faster, Prettier, and Better: Latest PRTG Preview Release with a New Interface

prtg release 17.3.34 with a new interface
Caution, wet paint! We have reworked PRTG Network Monitor to give our network monitoring solution a fresh new look.
sunburst-newui.png
The new PRTG web interface

We're excited about the fresh, modern look, of course, but the main reason for the update is to implement specific usability improvements based on feedback gathered from our users:
  • Optimized User Navigation
    We cleaned up the main menu and designed it to be clear and uncluttered. The optimized user navigation is consistently reflected in every page.
  • Details are Displayed More Clearly on the Detail Pages
    Information on the detail pages has been re-arranged. You can find essential information in the middle area; additional information is visible, but no longer the focus. The latest look, which is clearer and more focused, plays a crucial role here.
  • Consistent Optimization for all Display Devices
    The new PRTG web interface now adapts itself even better to the display device, irrespective of whether it is a smartphone, laptop, or classic desktop monitor.
  • Icons in SVG Format
    All the icons are now integrated as vector graphics and thus, support high-resolution display devices.

Everything Is in Beautiful Black

Now you can invert the PRTG interface and display it on a black background. The colors are automatically adapted. In any case, it is worth checking out; feedback has been very positive so far.
sunburst-newui-dark.png
The new dark theme in PRTG

Everything Is New and Different?

The new interface is currently available as preview version 17.3.34. To try it out, we recommend you set up a fresh PRTG trial installation and update it with the preview channel under "Setup | Auto Update" (please see this manual page on how to choose a release channel). Sometime in the fall, we are planning to release the new interface in our stable channel.
Now take a few minutes to familiarize yourself with the new interface. Experience has shown that new user interfaces are unfamiliar at first. However, we're sure that you will soon get used to the fresh look and feel, and that you'll appreciate the improved usability. And, of course, we are looking forward to your feedback. To do so, simply send us an e-mail or use the comment function in our blog…
Note: If you have customized the PRTG web interface using one of the dedicated files, all your modifications will be lost after installing PRTG version 17.3.34. For details, see the Knowledge Base.
source: 

Kenali TROJAN

$
0
0


T = Trojan

Katakan anda dulu mengenal seseorang beberapa tahun yang lalu. Jika anda baru saja menerima email darinya tanpa berhubungan dengannya bertahun – tahun, sadari bahwa email itu mencurigakan dan jangan membuka lampirannya. Orang itu bisa jadi seorang hacker yang menunggu untuk menerjang masuk ke system anda menggunakan Trojan. 

Kuda Trojan adalah trik orang Yunani dulu untuk memasuki pasukan Troy, menaklukkan kota. Dengan persamaan itu, Trojan adalah program yang digunakan seorang hacker untuk masuk ke sebuah computer.

Bagaimana sebuah Trojan bekerja
Trojan adalah malware yang meniru sebuah aplikasi supaya pengguna tertipu dan menjalankannya. Contohnya sebuah Trojan mengajak pengguna menonton video untuk memasang program khusus, biasanya sebuah pintu belakang atau ransomware.
Trojans khusus memberikan akses jarak jauh ke computer. Bisa digunakan untuk meluncurkan serangan mengunduh Trojan lain, dan mengirim email spam.
Di akhir tahun 2014, sebuah keluarga baru Trojan menjadi headlines di berbagai berita: ransomware, malware yang khusus mengencryp data pengguna dan minta tebusan sebagai penukar kunci dekripnya.

Bagaimana mengidentifikasi dan menghapus Trojan?
Konsep di belakang sebuah Trojan adalah menipu pengguna dengan cara yang tidak bisa dideteksi. Lebih baik periksa ulang apa yang kita unduh atau klik. Perhatikan bahasa yang digunakan di email maupun web yang kita kunjungi, terutama jika mereka minta kita untuk mengunduh suatu program.

Jika anda masih ragu dalam mendeteksi Trojans, perlindungan terbaik untuk menjaga system anda bersih adalah dengan memasang program keamanan yang melindungi semua peralatan anda, Bitdefender.

Kontak kami untuk mendapatkan harga khusus BITDEFENDER

Smart Lighting as a Foundation for a Smart City

$
0
0

Smart Lighting as a Foundation for a Smart City

Connected street lighting can be leveraged for other IoT initiatives
Smart city is something of a catch-all buzzword. But, in some ways, it’s the ultimate application of the Internet of Things. A smart city requires ultra-dense network connectivity in support of a range of sensors—public safety, environmental quality, traffic monitoring, etc…—that all feed data into integrated, openly-accessible analytics engines that virtuously yield increasing levels of insight that can be used to smooth municipal management while improving quality-of-life for urban denizens.
By the same token, the smart city movement is an imperative given the massive and long-term influx of people from rural areas into increasingly crowded cities, something the United Nations has identified as a mega-trend.
But, with such an ambitious goal, where should civic officials focus their limited supply of capital to have an immediate impact that can also serve as a foundation for future projects?
In some cities, limited pilot projects have proven to be just that—one-offs that serve as a showpiece, but don’t create the environment of continued investment and innovation. Following from that, the goal should be targeted investment that comes with a clear path to ROI. With a return on an investment, and potentially new revenue sources, city leaders can continue to invest in IoT.
Chicago_Smart_Lighting.jpgIn terms of smart city enablement, Silver Spring Networks has emerged as a major player with a range of product, platform and service offerings that cover smart utilities, traffic management, sustainability and smart lighting.
Connected lampposts that can be centrally managed do two things for a city: they cut down on power costs and bolster sustainability goals. But, much more than that, smart lighting can serve as a platform for a wide range of IoT initiatives that, in sum, can create a smart city.
Cities install lights where people already are—in commercial districts, major thoroughfares, tourists hot spots and around marquee venues. Lighting infrastructure is already connected to the power grid, and ideally, to a utility fiber network. And light poles are elevated above street level providing an optimal location for small cells, which are seen as a key enabler of everything smart city.
To that wireless infrastructure piece, scaling small cell deployments face two major challenges: access to power, backhaul and site acquisition. Second, if you’re a carrier or neutral host provider looking to deploy hundreds or thousands of small cells in a given area, it’s easier to negotiate a batch deal for placement with a city than it is to deal with a range of incumbents that already have wires and equipment hanging off of utility poles.
Further, small cell infrastructure providers are already working with lighting providers to integrate the RF equipment into light poles. So, when a city is ready to a replace a couple hundred street lights, they could opt for a pre-integrated solution that adds network density, creates a platform for all kinds of IoT solutions and accommodates a speedy deployment that can start adding value to municipal operations more quickly.

LEARN MORE ABOUT LINK LABS SMART CITY SOLUTIONS.

Back to Silver Spring Networks. The company says street lights create “a foundation for long-term value. By leveraging the same network for the deployment of additional smart city applications over time, your city can greatly reduce long-term costs and accelerate speed of deployment for these new services. Our robust partner ecosystem and strict adherence to open standards empower your city to have the greatest selection of solutions and applications and limitless extensibility, enabling you to forge your own path to the smart city future.”
Case in point, the company lent its smart lighting platform to a project undertaken by the city of Chicago to connect some 250,000 light fixtures. The four-year project will update some 85% of municipally-owned light fixtures with LED lights, which are expected to consume 50% to 75% less energy than the existing lighting system. But that’s just the beginning.
“The city of Chicago’s lighting replacement initiative will be one of the largest modernization programs to date in the U.S., and we could not be prouder to be part of such an incredible undertaking,” Mike Bell, Silver Spring Networks president and CEO, said. “Mayor [Rahm] Emanuel’s commitment to improving the lives of citizens and neighborhoods across the city...with state of the art IoT technology is inspiring. We’re very excited to see it come to fruition, while laying the foundation for future smart city applications.”
Note the reference to “future smart city applications.” Louis Maltezos, EVP of project stakeholder Ameresco, said the new lighting “will increase the energy efficiency of the system while helping to improve visibility and safety.” He’s referring to safety as a function of improved lighting—no more dark alleys--but take that a step further.
The light poles will be integrated with the city’s 311 system, which provides a portal for access to city services. But what if it were integrated, in the future, to the 911 system? Companies like ShotSpotter have seen good traction for public safety-related IoT solutions like gunshot detecting sensors. You use the lamp post as a host for a sensor that can detect the sound of a gunshot, or person screaming for help, then use the connectivity infrastructure already there to alert police to the precise location of an incident.
Down in Atlanta, AT&T, which has a big presence in the city already with its connected car and smart home IoT research and development groups based there, is working with the city on creating a smart city with connected lighting as the first step. That first step involves putting up 1,000 wirelessly-controlled LED lights in partnership with GE, city leaders and utility provider Georgia Power. Among other locations, the new lighting systems will go up in Buckhead Loop, Mercedes Benz stadium and the North Avenue Corridor. GE Current is providing its IoT sensor platform for the lighting sites. Broader goals of the project include:
  • Reducing traffic congestion and decreasing commute times;
  • Improving police response time and reducing crime;
  • And cutting down on vehicle emissions and other pollutants.

Using the street light as the location, sensors, cameras and other IoT devices can help achieve these goals.
“Utilities are critical to the success of building smarter cities across the region—and the country,” Mike Zeto, general manager and executive director, AT&T Smart Cities, said. “Our smart cities framework brings together utilities, economic development organizations, research institutions, tech companies, the developer community and, of course, the cities themselves. This helps drive real value to cities and their citizens. This holistic smart cities strategy can improve the quality of life for citizens. They’re on their way to becoming one of the most connected cities in the country.”
Zeto referenced AT&T’s smart cities framework, which the carrier put out in 2016. Building on partnerships with a range of players including Cisco, Deloitte, Ericsson, GE, IBM, Intel and Qualcomm, the goal is use spotlight cities to showcase the real value of a smart city applications covering utilities, street lighting, water systems, infrastructure, citizen engagement, transportation and public safety.
Let’s consider how a connected lighting site can support some of those application sets:
  • Utility providers can use connected street lights to reduce power consumptionby remotely adjusting usage;
  • A lamp post that houses a small cell can connect nearby sensors that could help a water utility monitor water flows and proactively address flood abatement;
  • Connected street light sites can also house traffic cameras and sensors that can provide data to a traffic management system;
  • Lighting infrastructure can be leveraged to provide public Wi-Fi hot spots and even kiosks that facilitate easy access to city services;
  • And connected light posts can serve as a platform for security cameras, gunshot monitors and other IoT solutions designed to increase public safety.
The point is, city’s can invest in street lighting to quickly see ROI based on lower energy costs, while setting the stage for myriad other IoT initiatives that, when put together, turn a city into a smart city.
source: https://www.link-labs.com/blog/smart-lighting-as-a-foundation-for-a-smart-city

Cloud: Operations vs. IT

$
0
0

Cloud: Operations vs. IT

Cloud computing has become an integral part of our lives. We use it for storing pictures and data, listening to music, navigation services and many other activities in our personal lives. Companies commonly use cloud services to exchange emails, office documents and other data—sometimes even sensitive data. Remote banking application are hosted in the cloud, for example, and the major enterprise resource planning (ERP) providers now offer cloud services that are sometimes more sophisticated than on-premise applications.
Where cloud is still almost not even considered an option is operations. The idea of sharing data over the Internet still scares many, preventing the adoption of such solutions. Cloud-based functionality offered by traditional automation and manufacturing execution system (MES) platforms is rapidly increasing. But which opportunities can cloud services provide to operations? How can automation take advantage of the cloud?
Here are some ideas:
  • Cloud can reduce capital expenditures. The entire hardware structure could be outsourced and optimized basing on actual needs, without requiring investments in hardware and without upgrade costs. In fact, the environment could be scaled without requiring any major change to company infrastructure, instead just adapting the actual services.
  • IT infrastructure maintenance no longer needs to be the responsibility of operations, which typically lacks the necessary skills or competences.
  • Cloud can improve performance. Providers can set up powerful and highly efficient infrastructures, splitting the required investments between many customers and offering them tailor-made architectures.
  • Security of data is guaranteed from the service provider, which respects the most updated and recognized international standards, particularly because security is a fundamental prerequisite for clients to even consider moving their data into the cloud.
  • Data in the cloud can be aggregated and manipulated using advanced algorithms, some of which are available only in the cloud. Using these algorithms, operations can better predict disruptions or deviations from a system’s usual behavior. Operations can also correlate production data with information available from other cloud service providers, such as weather data, creating new information. Best of all, data can be accessed from anywhere.
Considering all these benefits, why are companies not yet widely moving their operational data to the cloud?

Let’s consider how companies are structured: Usually, operations is in charge of all automation and production data, and IT manages ERP and business data. They’ve traditionally been two completely separate departments, not talking each other or, even worse, often fighting.
The increasing diffusion of MES is now flipping the game. MES is positioned between production and ERP, a kind of middle earth connecting IT and operations—production needs data from ERP and ERP needs data from production. For this reason, IT is becoming more involved in production data and operations needs more IT expertise.
So, when this kind of system is introduced in a company, IT and operations are forced to cooperate sharing knowledge, expertise and habits, creating a common shared governance. The expectation is that the same thing would happen for cloud.
Once IT shares with operations what it has learned about cloud computing, more data will migrate to the cloud, further enabling the development of new features or totally new scenarios.

But when cloud systems were first commercialized, IT was very adverse. “Cloud” was synonymous with “data loss,” “security breaches,” “IP violation” and a lot of other treats. When cloud solutions were proposed to operations, they had to ask IT for implementation and the answer was usually: “No, it will never happen!” Operations departments have been persuaded by IT that “cloud is evil,” so all solutions have remained on premise.
Things changed when ERP providers started to offer cloud solutions and office suites became online services. IT got used to buying cloud solutions for business applications. But this mindset change was unfortunately not shared much with operations, which still does not consider cloud an option.
Meanwhile, a lot of new features dedicated to operations have been made available in cloud: historization of process data, predictive maintenance, data analytics, reporting and dashboarding, for example.
What IT needs to do now is to share with operations what it has already learned: Cloud computing is more secure than it was originally; cloud infrastructure is optimized to manage production data; and the value of moving data into the cloud is much higher than the risk. Once this happens, more data will migrate to the cloud, further enabling the development of new features or totally new scenarios.
Who knows? Maybe in five years, the cloud will enable industry to apply artificial intelligence algorithms to automatically optimize supply chain coordination, extending the benefits from a single company to the full value chain, coordinating all the activities occurring from the first raw material producer to the final consumer, creating new data that for a single company or user wouldn’t be otherwise available, expanding traceability to new levels, improving quality of goods or services in a way that today cannot even be imagined.
Elisa Costa is software engineer at Autoware, a certified Control System Integrators Association (CSIA) member based in Vicenza, Italy. Luigi De Bernardini is and CEO at Autoware and president of Autoware Digital. For more information about Autoware, visit the Autoware profile on the Industrial Automation Exchange.

5 key success factors for cloud implementation

$
0
0
Share this post:
The journey to the success factors cloud implementationcloud is different for every organization. Some organizations start with a very well thought out strategy, while other organizations may be responding to a request from the business, or to a report by industry analysts such as Gartner or Forrester.
A study from the IBM Center for Applied Insights found that companies that outsource IT are eager for the benefits that cloud has to offer. And while many have already begun their journey to cloud, many are finding themselves in relationships with multiple outsourcing providers, and the ensuing transitions can be a bit complicated.
Marsha Trant, who manages worldwide cloud sales for the IBM outsourcing business and authored the study, spoke about her study’s findings. The study, titled Cloud bound: Advice from organizations in outsourcing relationships, gathers advice from those who’ve traveled the cloud road and provides important insights to organizations making this transition. The authors interviewed IT people, predominantly, and found that in some form or other, many were already using cloud.
Here are five key takeaways from the study findings:
1. A new due diligence process will be required; you ought to be prepared to invest more time and effort to finding the ideal partner. Explore your options. Look beyond the marketing, explore their development roadmaps, contingency plans, and get client references if possible. In the cloud world, there is an ever-expanding ecosystem from which to learn, so take the time to educate your internal stakeholders and get technical help if there is a skills gap.
“Talk to cloud firms about their development process, how they source data centers, and how they manage code and do releases. Really understand these new techniques.”
– CIO, manufacturing
2. Expect to pay more attention to security, as it is a primary concern for many stakeholders. Expect an increased level of internal scrutiny, and questions around data resiliency. Acknowledge concerns, as the cloud is a new technology for many. Get your providers to lend a hand in addressing the concerns of your team. Everyone should be comfortable that the cloud vendor can really mitigate risk and adequately address business requirements.
“Our old-school security folks didn’t want anything to go to the cloud. But we said, ‘Cloud isn’t going away – so how do we make sure we’re protected? Rather than putting up walls, be part of the solution.’”
– Senior IT director, pharma
3. The study found many pushing the limits on, or altering the dynamics of their current provider’s relations. Cloud services contracts are markedly different than outsourcing contracts – the former are designed to allow change and flexibility over time, while the latter do just the opposite; holding vendors to very strict guidelines. Keep expectations high, but don’t expect to reach a steady state with limited change. You will need to cultivate a different type of relationship where you lean on your vendor for strategic guidance, business case development, workload prioritization and more.
“It’s important for vendors to bring innovation, not just deliver what you’ve signed up for. We require biannual meetings with the provider’s senior technical architects to brainstorm technology and platform improvements.”
– Head of procurement, consumer goods
4. Plan to spend more time helping the business adjust to the new technology. Cloud services require a different governance approach, and procurement and contracting processes often need to be altered requiring greater business leader engagement. Everyone needs to be in sync on how solutions are selected and implemented. More time will be required to get business buy-in, and then keep them closely involved during the implementation process to manage stakeholder expectations. It is critical to be transparent keeping business leaders and others informed of outages – timing, impacts, and duration.
“We won’t do anything without close interaction with our senior clinical officers. They have to know and support the effort. A CIO housed on his or her lone branch is doomed to failure. We have regular meetings to update the President and senior LOBs on where we are.”
– CIO, healthcare
5. Thinking ahead about an integration plan is critical. Because the cloud is made for a “best of breed” approach, you should plan for a more diverse vendor base and a hybrid IT environment. The complexities associated with expansive hybrid environments mandates solid planning. The study suggests appointing a single point of contact to manage and set the stage for well-orchestrated and productive interactions within your network of providers.
“In the future, we’re not going to see one gigantic cloud player. We’re not going to put everything in a single basket somewhere in the cloud. I honestly believe it will be a combination, a portfolio of partners.”
– CIO, consumer goods
One of the CIOs in the study related that they wanted to get the momentum that they required to stay competitive. He wanted to see discretionary dollars spent on moving his company toward the future, rather than anchoring them in the past. This quote really rang true with Trant. The journey will be different for organizations, and while Trant doesn’t suggest starting with mission critical systems, she suggests that it may well be that mission critical systems are ultimately where the real value will be found.

Cloud infographic IBM

This post was originally published on Thoughts on Cloud in October 2014.
source: https://www.ibm.com/blogs/cloud-computing/2017/10/5-key-success-factors-cloud-implementation-2/

Ruang kerja terpadu = Unified Workspace dengan Awingu

$
0
0
Dimanakah saat ini anda bekerja ?
Pertanyaan yang sekarang mulai banyak dijawab dengan: "di luar kantor", "di cafe", hingga "di rumah". Apakah ada yang salah dengan ini ? Mungkin tidak. Manusia Indonesia sangat terkenal ramah dan suka berinteraksi satu dengan yang lain. Semua ini didukung dengan perkawanan dan persaudaraan yang erat. Sehingga menghabiskan waktu dengan bertemu satu dengan yang lain menjadi sangat tinggi.
Dalam mendukung customer selama ini, mobile user ataupun mobile worker semakin banyak dari waktu ke waktu. Tidak hanya untuk industri yang memang menekankan banyaknya karyawan atau mitra di luar kantor, juga kecenderungan waktu dan efisiensi menjadi faktor utama.
Oleh karena itu, banyak perusahaan berusaha sebaik mungkin untuk mengembangkan solusi teknologi mendukung mobile user dan mobile worker ini. Mulai dari merubah aplikasi bisnisnya menjadi berbasis web, penggunaan aplikasi native, hingga mengakses data secara remote. Semua ini memiliki tantangan sendiri-sendiri. Dan yang paling utama biasanya adalah kerumitan mereka mengatur user yang memiliki perangkat berbeda-beda. Kemudian tiap perusahaan memerlukan waktu untuk mengubah aplikasi, membuat aplikasi native dan melatih ulang user mereka menggunakan aplikasi baru. Belum lagi kendala lambatnya akses data mereka oleh karena berbagai hal terkait aplikasi. Semua ini semakin memusingkan banyak perusahaan. Padahal apabila kita perhatikan, kebutuhan akses user atau mobile worker terhadap akses aplikasi atau data, umumnya hanya kepada aplikasi dan data tertentu yang selalu sama dari waktu ke waktu. Tidak lupa juga ketakutan banyak perusahaan atas penyalahgunaan file dan database mereka, karena semua file dan data ada di beragam perangkat user.
Oleh karena tantangan itulah, Awingu ada. Awingu membantu perusahaan untuk menyediakan ruang kerja terpadu secara virtual. User akan mudah mengakses aplikasi yang selama ini mereka bisa akses di media desktop mereka. User bisa mengakses file yang sering mereka akses. Dengan menggunakan arsitektur Awingu, maka banyak perusahaan dapat terbantu.

Dengan Awingu, semua aplikasi existing dapat dengan mudah diakses. Demikian juga dengan penyimpanan file, dapat tetap dikonsolidasi di pusat, sehingga semua data menjadi aman terkendali.
Awingu membantu user juga dengan mudah mengakses aplikasi dan data mereka dari mana saja, hanya dengan menggunakan media browser yang mendukung HTML5. Da semua bisa diakses dari perangkat desktop, mobile atau smartphone dan tablet mereka.
Semua ini akan memberikan ruang kerja terpadu untuk mobile user dan mobile worker.
Kata siapa sulit pindah ke cloud ? Dengan cara ini, perusahaan anda langsung menggunakan layanan cloud yang anda buat sendiri, dan yang paling penting, tidak banyak perubahan yang harus dilakukan dalam perusahaan anda. Cukup menambahkan server Awingu di depan aplikasi anda.
Kontak kami untuk menggunakan Awingu di perusahaan Anda - askme@dayaciptamandiri.com / 0881-8857333.

FTTH jaringan akses Fiber Optik dan teknologi G-PON

$
0
0

FTTH jaringan akses Fiber Optik dan teknologi G-PON


Apa yang dimaksud dengan FTTH
Fiber To The Home atau yang disebut dengan FTTH, adalah suatu jaringan akses atau jaringan yang menghubungkan antara pusat layanan dengan peralatan pelanggan atau Customer Premises Equipment (CPE) dengan menggunakan Fiber Optik.
Alasan mengapa harus menggunakan Fiber Optik.
a.  Dapat menyalurkan informasi dengan kecepatan yang sangat tinggi,
     atau berpita lebar High Speed Data ( > 100 Mbps)
b.  Dalam satu Fiber Optik dapat menyalurkan informasi dua arah ( transmit
    dan receive),   hal ini berbeda dengan saluran tembaga yang memerlukan
    dua saluran yang berbeda untuk arah kirim dan arah terima.
c.  Karena dapat menyalurkan High Speed Information, maka dalam satu
     fiber dapat melayan Voice, Video dan Data atau yang disebut dengan
     layanan Triple Play.

d.  Mempunyai sifat redaman / attenuation yang relatif kecil, sehingga jarak
     yang direkomendasi dari Pusat Layanan sampai dengan Pelanggan
     adalah 20 Kilometer, disamping itu noise maupun distorsi relatif kecil sekali.
e.  Secara teknologi, sistem menggunakan spliter atau satu fiber dapat
     dicabang ke beberapa 
     pelanggan , sehingga sangat effesien dalam pembangunan jaringan.
f.   Sangat memungkinkan untuk pengembangan teknologi jaringan yang
     memerlukan kecepatan  tinggi, misal untuk Jaringan ke Base Station.

Arsitektur FTTH

Secara umum arsitektur  jaringan FTTH mulai dari pusat layanan sampai dengan pelanggan
adalah sebagai berikut,

1. OLT  = Optical Line Terminal , atau perangkat yang mempunyai fungsi;
                  a.  Titik Hubung dengan provider layanan Telepon, Internet/Data
                       dan TV/ IP TV
                  b.  Pusat penyambungan dan distribusi layanan yang dikirim
                       ke pelanggan.
                  c.  Pengaturan dan monitoring jaringan pelanggan.
                  d.  Mengkonversi sinyal layanan ke dalam bentuk sinyal optik.

2. ODF  = Optical Distribution Frame, atau Rak dan frame yang berfungsi ;
                  a. Tempat Spliter untuk mendistribusikan Fiber Optik ke ODC
                      untuk melayani beberapa area.
                  b. Tempat melakukan pengukuran dan monitoring Jaringan Fiber Optik.
                  c. Tempat terminasi fisik jaringan luar Fiber Optik.

3.  Feeder Cables = Kabel Fiber Optik penghantar Layanan, yang mempunyai
                   fungsi
                a. Kabel Fiber Optik Penghubung Utama dari ODF ke ODC
                b. Ada tiga jenis kabel Fiber Optik yang digunakan, yaitu
                 1  Kabel Duct yang menggunakan pelindung pipa PVC dengan
                     lapisan cor beton 
                 2.  Kabel Tanah Tanam Langsung ( Burried Cables) dengan pelindung
                      pipa HDPE.
                 3.  Kabel Udara atau aireal cable yang ditambatkan pada tiang
                      besi atau beton.

4. ODC    = Optical Distribuion Cabinet atau perangkat Lemari  Kabel Fiber Optik
                     dengan fungsi sebagai berikut ; 
                    a. titik sambung untuk penyebaran layanan ke beberapa area yang
                       lebih kecil 
                    b. tempat splitter untuk yaitu dari satu Fiber optik ke beberapa
                        fiber optik.
                    c. tempat koneksi dari Kabel Feeder ke Kabel Distribution


5.  Kabel Distribution = Kabel Fiber Optik yang mendistribusikan layanan ke area
                     yang lebih kecil
                     a. Menggunakan kabel tipe Single Core Single Tube atau SCST
                     b. Sebagai penghubung antara ODC dengan ODP

6.  ODP      = Optical Distribution Point atau kotak distribusi layanan ke
                       pelanggan, fungsinya adalah;
                     a. Sebagai titik terminasi kabel dropp optik ke arah pelanggan.
                     b.  Sebagai titik distribusi kabel distribusi menjadi beberapa saluran
                          dropp optik dengan menggunakan splitter.
                    c.  Ada 3 (tiga) jenis ODP , yaitu ;
                           1.  ODP Pedestal ODP yang ditempatkan pada permukaan tanah


                           2.  ODP Pole/ Wall ODP yang ditempatkan pada tembok atau
                                tiang.


                           3.  ODP Closure, ODP yang ditempatkan pada kabel diantara
                               dua tiang

7. Dropp Optic = yaitu saluran penanggal atau penghubung instalasi rumah.
                          a. Penghubung antara ODP dengan instalasi Rumah.
                          b. Menggunakan jenis insensitive bending, atau tahan dengan
                              tekukan.
                          c.  Kapasitas 1, 2 dan 4 core.
                          d.  Panjang maksimum 250 meter
                          e.  Kedua ujungnya dipasang konektor
                          f.  Antar kedua ujung konektor tidak boleh terdapat sambungan
                              atau lecet.

8.  OTP  = Optical Termination Premises., yaitu perangkat pasive yang
                  ditempatkan pada instalasi rumah pelanggan.
                  Fungsi dari OTP, adalah sebagai berikut ;
                  a.  Titik terminasi atau titik tambat akhir dropp optik di sisi pelanggan.
                  b.  Tempat koneksi kabel dropp optik dengan kabel indooor optik
                       (patchcord)


9.  Indoor Fiber Optic Cables,
                 Kabel Fiber Optik yang diinstalasi untuk dalam rumah, pada umumnya
                 disebut juga patchcord, dimana kedua ujungnya sudah tersambung
                 dengan konektor.

10. Roset Optic atau kotak tempat penghubung antara indoor optik cables
                dengan kabel optik arah CPE ( Customer Premises Equipment)
                dalam bentuk ONT/ONU

11.  ONT/ ONU = Optical  Network Terminal atau Optical Network Unit.
                 Fungsinya adalah :
                  a. Melakukan konversi layanan dalam sinyal optik menjadi
                      sinyal elektrik
                  b. Sebagai alat demultiplexer layanan 
                  c. Output layanan ONT/ONU adalah Voice, Video/ IP TV
                      dan Data Internet

      Perbedaan antara ON dan ONU, adalah sebagai berikut ;
      ONT hanya melayani satu pelanggan saja.

       ONU dapat melayani beberapa pelanggan dalam satu kluster, misal untuk  
       Pertokoan, Mall dan Apartemen.

     Teknologi GPON
Teknologi G-PON adalah teknologi yang digunakan untuk mengatur trafik layanan pada jaringan FTTH. Disebut dengan GPON karena mempunyai bitrate informasi yang lebih dari 1 Giga bit perdetik, disamping itu sifat pendistribusian layanan pada jaringan tidak memerlukan catuan daya listrik atau bersifat passive, sehinggga disebut dengan Pasive Optical Network.    
Tekologi ini merupakan penggabungan dari teknologi
a. Penyambugan / Switching
b. Penggabungan / Multiplexer
c. Pendistribusian akses pelanggan melalui FTTH
d. Jaringan IP
Secara konsep teknologi G-PON seperti pada gambar dibawah ini;


Arsitektur G-PON 

Arsitektur G-PON sangat sederhana yaitu hanya terdiri komponen
a. OLT Optical Line Terminal yang ditempatkan pada pusat layanan
b. Splitter yang ditempatkan pada ODC maupun pada ODP.
c. ONT atau ONU yang ditempatkan pada sisi pelanggan.


1. OLT merupakan komponen pusat penggabungan layanan triple play
dari beberapa operator jaringan
Setiap layanan dapat dihubungkan dengan bit rate 10 Gigabit perdetik
sedangkan pada sisi distribusi pelanggan mulai dari 1 Gbps - 2,5 Gbps

 Fungsi dari OLT jika pada jaringan Internet adalah merupakan layer -2 yaitu Data Network
yang berfungsi sebagai Switch, yang fungsinya adalah untuk
a. Penyambungan dengan Pusat Layanan ( Softswitch, ISP dan TV-Server)
b. Titik Distribusi awal ke beberapa area pelanggan.
c. Tempat pengaturan bandwidth, pengontrolan, monitor dan kendali jaringan pelanggan.

2. Splitter
Yaitu dapat dianalogikan dengan Multiplexer, yang berfungsi mendistribusikan layanan
dari satu fiber ke beberapa fiber dengan kapasitas, 1:2, 1:4, 1:8, 1:16, 1:32 dan 1:64
Kelemahan dari Splitter ini adalah menimbulkan Loss dimana semakin besar kapasitasnya
loss yang timbul semakin besar


3. ONT Optical Network Terminal
ONT ditempatkan pada sisi pelanggan, dimana sebagai interface atau titik penghubung dengan CPE (Customer Premises Equipment) yang berupa : 
a. PABX
b. Telepon
c. Faxmile
d. WIFI Internet
e. MODEM Internet
f. IP-TV

Cara Kerja G-PON

1. Teknologi GPON dalam menyalurkan trafik layanan ke pelanggan
    menggunakan dua metode yaitu ;
   a. WDM Wavelenght Division Multiplexer = atau penggabungan panjang gelombang
       sinyal optik yang berbeda menjadi satu berkas sinyal optik.
       untuk memisahkan jenis layanan dari OLT menuju ke ONT
   b. TDM Time Division Multiplexer, yaitu setiap pelanggan arah up stream dialokasikan
       time slot yang berbeda
      untuk memisahkan antar identitas pelanggan dari ONT menuju ke OLT


Pada teknologiG-PON terdiri dari dua tipe perangkat, yaitu ;
a. Perangkat Aktive terdiri dari : OLT , ONT dan ONU
b. Perangkat Pasive terdiri dari Kabel Feeder , Kabel Distribution, Splitter, Patch Cord

Keistimewaan teknologi G-PON;
a. Beroperasi dengan line rates pada 2.488 Gbps downstream dan 1.244 Gbps upstream 
   dengan  menggunakan single fiber, G-PON system harus sesuai dengan ITU-T 
    G.984.x series (G.984.1/2/3/4).
b. Modul GPON dapat diekspansi, yang memungkinkan terbentuknya sistem perangkat 
    yang fleksible. 
c. Sistem arsitektur GPON harus dalam satu rak yang terintegrasi untuk semua layanan.
d. Semua layanan di-manage/dikontrol oleh sebuah EMS (Element Management Services)
e. Interface backplane perangkat GPON harus berbasis arsitektur IP.
f. Kemampuan switching bersifat non-blocked matrix atau tidak terjadi kegagalan hubungan.

Kelemahan G-PON.
a. Instalasi fisik Fiber Optik harus bebas dari tekukan dan gulungan pada Fiber Optik.
    (tidak terjadi bending)
b. Teknisi harus menguasai teknologi jaringan IP.
c.  Kapasitas Splitter yang semakin besar akan menimbulkan Loss dan menurunnya
     kecepatan informasi pada User, oleh sebab itu perencanaan QoS harus akurat.

Panjang Gelombang Downstream ada dua jenis yaitu
a. 1490 nm untuk menyalurkan informasi Internet dan VoIP
b. 1550 nm untuk menyalurkan IP TV

Panjang gelombang Up Stream yang digunakan adalah,
1.310 digunakan untuk layanan Triple Play.

Trafik dari OLT ke ONT atau downstream semua dikirim keseluruh user yang tersambung 
dengan port OLT. Namun user hanya akan menerima informasi yang mempunyai IP address
yang sama dan untuk layanan sesuai tag/ label.


Spesifikasi Interface OLT pada G-PON untuk 1 Gbps dan 10 Gbps


Spesifikasi Interface ONT pada G-PON

Jaringan G-PON

Hubungan antar OLT menggunakan topologi Ring, agar dapat dilakukan sistem proteksi, yaitu jika salah satu ruas kabel optik terputus, maka dapat dilakukan pengalihan trafik secara otomatis yang disebut dengan sistem SHR atau Self Healing Ring. Pengalihan trafik secara otomatis dengan durasi waktu maksimal 50 milli detik.


Pada saat OLT-1 dengan OLT-2 kondisi recovery, maka jalur atau ruas OLT1 dengan OLT-2 dilakukan perbaikan.

Berikut adalah contoh hubungan antar OLT dalam kota Jakarta yang terdiri dari 5 ring utama.
source: http://sukkhendro54.blogspot.co.id/2016/01/ftth-jaringan-akses-fiber-optik-1.html

ServiceDesk Plus digunakan untuk semua manajemen layanan

$
0
0
Dalam beberapa kali implementasi ServiceDesk Plus, kami menemukan hal yang unik, dan bisa dilakukan. ServiceDesk Plus digunakan oleh berbagai unit kerja lain selain IT.

Dan ternyata hal itu didengar baik oleh ManageEngine, sehingga secara resmi kemampuan manajemen semua layanan untuk perusahaan dibungkus dalam fitur Enterprise Service Management.


Sehingga ServiceDesk Plus tidak hanya bisa digunakan oleh lingkup IT, bahkan bisa ke unit kerja lain, seperti HR, Facility, Finance, Legal dan Travel

Bagaimana hal ini bisa mungkin ?

Pertama, penggunaan portal bersama. Dengan ServiceDesk Plus, semua unit kerja bisa mengakses portal bersama dengan berbagai fiturnya.


Semua ini bisa terjadi karena semua manajemen user tersentralisasi sesuai dengan hirarki dalam organisasi yang di-setup dalam ServiceDesk Plus.

Bahkan kita bisa membuat custom untuk tiap unit kerja yang ada.


Dari sanalah kita bisa mengatur custom workflow sesuai kebutuhan masing-masing unit kerja.


Dan tentu saja mengatur manajemen request, katalog dan template tiap unit kerja.


Silahkan kontak kami untuk mendapatkan dukungan teknis terkait fitur ini, atau implementasi ServiceDesk Plus untuk perusahaan / instansi anda.


Clearance WatchGuard XTM series

$
0
0
Kami melakukan clearance sale untuk produk-produk WatchGuard XTM Series


Kondisi unit :
- Kondisi baru / belum digunakan / license belum diaktifkan
- Harga tidak termasuk instalasi / pengiriman luar jakarta
- Pembayaran 100% di muka
- Tidak termasuk instalasi / training
- PO sebelum 30 November 2017

Silahkan kontak kami : nurma@dayaciptamandiri.com / 0881-8867333


Update terbaru PHPRunner, ASPRunner.NET dan ASPRunnerPro - Nov 2017

$
0
0
 
while we are working on version 10 of PHPRunner, ASPRunner.NET and ASPRunnerPro here are some updates you may find useful. 
 
  1. MassMailer template v3 released
  2. SnapshotCam plugin updated
  3. SignaturePad plugin updated
  4. Updated online manual and how you can create one for your own app
  5. Web hosting deal
  6. How to make sure your maintenance is current
  7. Recent Windows 10 update issues
1. MassMailer template v3
 
New functionality in version 3:
  • Bootstrap-based appearance
  • Can send both emails and SMS via Twilio
  • Scheduling by day of the week
  • And the most important one - you can attach one of project pages like a report or a list page as HTML or PDF. Works with password protected pages as well. You can even make it work with 'Users can see and edit their own data only' feature and each user will receive their own copy of report in the mail. Isn't it amazing?
 
2. SnapshotCam plugin
 
SnapshotCam plugin was released for ASPRunner.NET and ASPRunnerPro plus a few more bugs fixed. 
 
 
3. SignaturePad plugin
 
SignaturePad plugin was updated to support background images. Also allows you to edit your signature. Apparently it has more applications than just a signature, i.e. a pain map. This plugin is a already a part of he software, just make sure you have the latest build of PHPRunner or ASPRunner.NET. Unfortunately this new functionality is not available in ASPRunnerPro.
4. Updated online manual
 
You may have noticed the new format of our online manual. We recently switched to the latest version of Help+Manual software that allows us generated CHM, PDF and online version of the manual from a single source. 
 
If you need to build a manual for your website or web application give them a try. We managed to arrange $100 discount only available to our newsletter subscribers. Valid tillNovember 16, 2017.
 
 
We are not affiliated with this company, just happy to spread a word about a great software. 
 
5. Web hosting special 

If you are looking for a web hosting for your web application check our offering athttp://www.inspirunner.comYou can receive $25 OFF if you sign up for 6 months service (use coupon code 2012SEMI) or $50 OFF if you sign up for 12 months service (use coupon code 2012ANN).
 
We support PHP (5.6 and 7.1), ASP, ASP.NET, MS Access, MySQL and SQL Server.

Also new Plesk Onyx 17.5.3 control panel provides access to Wordpress toolkit, Let's Encrypt, Git, Docker and much more.

Do not hesitate to ask if you have any hosting related questions. 
 
6. How do I make sure my maintenance is current
 
It is important to keep your maintenance up to date. Otherwise you will have to purchase version 10 at the full price. To make sure that you are current logon to customer portal, proceed to 'My purchases' and see what your last purchase or upgrade order for PHPRunner, ASPRunnerPro or ASPRunner.NET was placed. 
 
If your latest order was placed less than 12 months ago that means your maintenance is current. In other case you need to renew it before November 15th.

Maintenance renewal links:

PHPRunner 

ASPRunner.NET

ASPRunnerPro

7. Latest Windows 10 update breaks things
 
Customers running Windows 10 and 64-bit version of our software may noticed that software may crash when you close the project. As a temporary solution you can switch to 32-bit version of the software or uninstall the latest Windows update. We are looking for a permanent solution. 

HOW TO MONITOR SERVER ROOM TEMPERATURE WITH PRTG ON A BUDGET

$
0
0

High server room temperatures mean high risks for the ITHigh server room temperatures mean high risks for the IT
We want to monitor the temperature of our server room, and we want to do it on a budget. Maybe because we are, or maybe because we can! What do we need?
  • Raspberry Pi Zero W: ca. $10
  • Power supply for the Pi: ca. $10 (you can even use a Powerbank to make this thing mobile!)
  • Mirco SD Card for the Pi: ca. $8
  • Case for the Pi: ca $5
  • Enviro pHAT for the Pi: ca. $16
  • Obviously we need PRTG Network Monitor with its HTTP Push Data Advanced Sensor
As we use the free version of PRTG (limited to 100 sensors), that brings us to a grand total of 49$. If that's not on a budget, I don't know what is. And we get to have fun and play with a Raspberry PI and even do a bit of soldering if that's your thing. If you prefer to connect the Enviro pHAT not via soldering, there are solder-free options offered from certain RaspberryPi oriented shops, just run it through Google.
You can also opt for a full Raspberry Pi, that will drive up the cost to about 30-35$, but gets you the benefit of wired Ethernet connectivity.
As a prerequisite, the Raspberry Pi should be ready to start, SD card inserted, with an either full or lite installation of Raspbian, SSH access enabled, and Python3 installed (it's part of the full Raspbian Installation, but not the lite one, so you may need to install it via sudo apt-get). And it needs to be able to connect to your PRTG installation, either wirelessly or via Ethernet.

HARDWARE ASSEMBLY

This is pretty straight forward, plug or solder the Enviro pHAT onto the Pi, and connect it to the power supply. Voila.
enviro-phat-artikel.png

THE SOFTWARE SIDE OF THINGS

This has a few more steps.

INSTALL THE NECESSARY PACKAGE ON THE PI.

There are three options to do this, choose the one which suits your python work flow best:
  • Do a full install of the package, directly from pimoroni (the vendor of the Enviro pHAT):
    curl https://get.pimoroni.com/envirophat| bash
  • Global installation for the entire Pi, do this if the Pi won't do anything else:
    sudo apt-get install python3-envirophat
  • Installation within a virtual environment just for this project (if the Pi is running other Python scripts / applications, and you don't want to risk any interferences with their libraries / modules):
    sudo /home/pi/enviro_env/pip3 install envirophat (The path is just an example of course.)
That's it, let's get into the script!

THE PYTHON SCRIPT, WHICH COLLECTS THE DATA AND SENDS IT TO PRTG

Modules, what do we need? All of them! j/k. We need:
import time
import requestsfrom envirophat import weather, light
time is necessary for setting the script to sleep for 60 seconds after its tasks have been done, because we are letting it start when the Pi boots, and then run it in an endless loop. requests helps us sending the data to PRTG and weather and light from envirophat are necessary to measure the values in the first place.
Then we need connection data so that the script knows where to send the data:
prtg_host = 'IP_OF_THE_PRTG_PROBE'
prtg_host_port = '5050'prtg_sensor_token = '1420F0AD-2249-428A-B176-089E113EA551'
If you want to run the HTTP Push Data Advanced Sensor, the prtg_host needs to be the IP/hostname of the Remote Probe of course. Port & Token can be set and then taken from the HTTP Advanced Sensor:
Port and Token from the HTTP Advanced SensorPort and Token from the HTTP Advanced Sensor
Houston we have a function! That reads the temperature, air pressure and light, packing them into a nice json structure, which it returns to the main part of the script. Take a look:
temperature = weather.temperature()
pressure = round(weather.pressure(), 2)
light = light.light()
json_response = {
   "prtg": {
      "result": [
      {
         "channel": "temperature",
         "float": 1,
         "value": temperature
      },
      {
         "channel": "pressure",
         "float": 1,
         "value": pressure
      },
      {
         "channel": "ambient light",
         "float": 1,
         "value": light
      }
      ]
   }
}
return json_response
The 'rest' is a never-ending while loop. It calls the function to gather the values, and send the values to the set PRTG instance. If it cannot reach PRTG (for example, because PRTG is being updated in that moment), it will wait for the next turn.
try:
   json_response = get_values()
   # print output for debugging   # print(json_response)   json_string = str(json_response)   json_string = str.replace(json_string, '\'','\"')   prtg_request_URL = 'http://' + prtg_host +':' + prtg_host_port + '/' + prtg_sensor_token +'?content=' + json_string   # print(prtg_request_URL)   request = requests.get(prtg_request_URL)   # print(request.status_code)except:
   pass
After the values are collected, requests is used to transmit them to PRTG with an HTTP GET request. The prints of the request URL, status code and before the json content, are intended for debugging, you can of course remove them once the script is running smoothly.
And we're done. Look Ma'! Values in PRTG: 
raspberry-pi-enviro-monitor-1.png
raspberry-pi-enviro-monitor-3.png
The interval is set to 60 seconds for the example. 5 minutes would be good just as well. While air pressure may not be that interesting, the light - value can be used a presence indicator (alert if someone is in the server room, when there shouldn't be!).
The Enviro pHAT even offers a motion sensor. This could be used to read motion data to serve as tempering- /burglar alert depending how you mount the Pi/ Enviro pHAT.
One final thought, if the Enviro pHAT is mounted directly onto the Pi, the temperature reading will have a certain offset, because of the proximity to the CPU of the Pi. In a server room this off set should be quite stable, so you can use a Factory Sensor in PRTG to subtract it. Or you'll bring a bit of distance between the Pi and the Enviro pHAT with cables to connect them.

GET THE FULL CODE

For the full code in a piece please check this link: code in the Paessler knowledge base

THE HTTP PUSH DATA ADVANCED SENSOR

If it's about IoT and integrating devices without IP-address into PRTG, the http Push Data Advanced Sensor is a very powerful tool. Learn more about it at the PRTG manual: https://www.paessler.com/manuals/prtg/http_push_data_advanced_sensor

THE AUTHOR

Before joining our tech support team about 9 years ago, Torsten used to work as an IT administrator in Germany and China. In his free time he likes to play around with tech stuff to enhance his programming skills, and he writes about it in his private blog https://herrschroedinger.codes
source: https://www.paessler.com/blog/how-to-monitor-server-room-temperature-with-prtg-on-a-budget

Membangun Security Operations Center (SOC)

$
0
0

How to build and run a Security Operations Center


Security Operations Center

Today’s Cyber security operations center (CSOC) should have everything it needs to mount a competent defense of the ever-changing information technology (IT) enterprise.
This includes a vast array of sophisticated detection and prevention technologies, a virtual sea of cyber intelligence reporting, and access to a rapidly expanding workforce of talented IT professionals. Yet, most CSOCs continue to fall short in keeping the adversary—even the unsophisticated one—out of the enterprise.
Ensuring the confidentiality, integrity, and availability of the modern information technology (IT) enterprise is a big job.
It incorporates many tasks, from robust systems engineering and configuration management (CM) to effective cybersecurity or information assurance (IA) policy and comprehensive workforce training.
It must also include cybersecurity operations, where a group of people is charged with monitoring and defending the enterprise against all measures of cyber attack.

What Is a SOC?

A SOC is a team primarily composed of security analysts organized to detect, analyze, respond to, report on, and prevent cybersecurity incidents.
The practice of defense against unauthorized activity within computer networks, including monitoring, detection, analysis (such as trend and pattern analysis), and response and restoration activities.
There are many terms that have been used to reference a team of cybersecurity experts assembled to perform CND.
They include: ‚
  • Computer Security Incident Response Team (CSIRT) ‚
  • Computer Incident Response Team (CIRT) ‚
  • Computer Incident Response Center (or Capability) (CIRC) ‚
  • Computer Security Incident Response Center (or Capability) (CSIRC) ‚
  • Security Operations Center (SOC) ‚
  • Cybersecurity Operations Center (CSOC)
  • ‚ Computer Emergency Response Team(CERT)
In order for an organization to be considered a SOC, it must:
  • 1. Provide a means for constituents to report suspected cybersecurity incidents
  • 2. Provide incident handling assistance to constituents
  • 3. Disseminate incident-related information to constituents and external parties.

Mission and Operations Tempo

SOCs can range from small, five-person operations to large, national coordination centers. A typical midsize SOC’s mission statement typically includes the following elements:
1. Prevention of cybersecurity incidents through proactive:
  • a. Continuous threat analysis
  • b. Network and host scanning for vulnerabilities
  • c. Countermeasure deployment coordination
  • d. Security policy and architecture consulting.
2. Monitoring, detection, and analysis of potential intrusions in real time and through historical trending on security-relevant data sources
3. Response to confirmed incidents, by coordinating resources and directing use of timely and appropriate countermeasures
4. Providing situational awareness and reporting on cybersecurity status, incidents, and trends in adversary behavior to appropriate organizations
5. Engineering and operating CND technologies such as IDSes and data collection/ analysis systems.
Of these responsibilities, perhaps the most time-consuming are the consumption and analysis of copious amounts of security-relevant data. Among the many security-relevant data feeds a SOC is likely to ingest, the most prominent are often IDSes.
IDS’es are systems placed on either the host or the network to detect potentially malicious or unwanted activity that warrants further attention by the SOC analyst. Combined with security audit logs and other data feeds, a typical SOC will collect, analyze, and store tens or hundreds of millions of security events every day.
According to an event is “Any observable occurrence in a system and/or network. Events sometimes provide an indication that an incident is occurring” (e.g., an alert generated by an IDS or a security audit service). An event is nothing more than raw data.
It takes human analysis—the process of evaluating the meaning of a collection of security-relevant Fundamentals Ten Strategies of a World-Class Cybersecurity Operations Center 11 data, typically with the assistance of specialized tools—to establish whether further action is warranted.

Tier Level:

  1. Tier 1
  2. Tier 2
  3. Tier 3
  4. Soc Manager

Tier 1: Alert Analyst

Duties
Continuously monitors the alert queue; triages security alerts; monitors health of security sensors and endpoints; collects data and context necessary to initiate Tier 2 work.
Required Training
Alert triage procedures; intrusion detection; network, security information and event management (SIEM) and host-based investigative training; and other tool-specific training. Certifications could include SANS SEC401: Security Essentials Bootcamp Style.

Tier 2: Incident Responder

Duties
Performs deep-dive incident analysis by correlating data from various sources; determines if a critical system or data set has been impacted; advises on remediation; provides support for new analytic methods for detecting threats.
Required Training
Advanced network forensics, host-based forensics, incident response procedures, log reviews, basic malware assessment, network forensics and threat intelligence. Certifications could include SANS SEC501: Advanced Security Essentials – Enterprise Defender; SANS SEC503: Intrusion Detection In-Depth; SANS SEC504: Hacker Tools, Techniques, Exploits and Incident Handling.

Tier 3 Subject Matter Expert/ Hunter

Duties
Possesses in-depth knowledge of network, endpoint, threat intelligence, forensics and malware reverse engineering, as well as the functioning of specific applications or underlying IT infrastructure; acts as an incident “hunter,” not waiting for escalated incidents; closely involved in developing, tuning and implementing threat detection analytics.
Required Training
Advanced training on anomaly detection; tool-specific training for data aggregation and analysis and threat intelligence. Certifications could include SANS SEC503: Intrusion Detection In-Depth; SANS SEC504: Hacker Tools, Techniques, Exploits and Incident Handling; SANS SEC561: Intense Hands-on Pen Testing Skill Development; SANS FOR610: Reverse-Engineering Malware: Malware Analysis Tools and Techniques.

SOC Manager

Duties
Manages resources to include personnel, budget, shift scheduling and technology strategy to meet SLAs; communicates with management; serves as organizational point person for business-critical incidents; provides overall direction for the SOC and input to the overall security strategy
Required Training
Project management, incident response management training, general people management skills. Certifications include CISSP, CISA, CISM or CGEIT.

The SOC typically will leverage internal and external resources in response to and recovery from the incident. It is important to recognize that a SOC may not always deploy countermeasures at the first sign of an intrusion. There are three reasons for this:
  • 1. The SOC wants to be sure that it is not blocking benign activity.
  • 2. A response action could impact a constituency’s mission services more than the incident itself.
  • 3. Understanding the extent and severity of the intrusion by watching the adversary is sometimes more effective than performing static forensic analysis on compromised systems, once the adversary is no longer present.
To determine the nature of the attack, the SOC often must perform advanced forensic analysis on artifacts such as hard drive images or full-session packet capture (PCAP), or malware reverse engineering on malware samples collected in support of an incident. Sometimes, forensic evidence must be collected and analyzed in a legally sound manner. In such cases, the SOC must observe greater rigor and repeatability in its procedures than would otherwise be necessary.

Building a Security Operations Center

In addition to SOC analysts, a security operations center requires a ringmaster for its many moving parts.
The SOC manager often fights fires, within and outside of the SOC. The SOC manager is responsible for prioritizing work and organizing resources with the ultimate goal of detecting, investigating and mitigating incidents that could impact the business.
The SOC manager should develop a workflow model and implement standardized operating procedures (SOPs) for the incident-handling process that guides analysts through triage and response procedures.

Processes

Defining repeatable incident triage and investigation processes standardize the actions a SOC analyst takes and ensures no important tasks fall through the cracks.
By creating repeatable incident management workflow, team members’ responsibilities and actions from the creation of an alert and initial Tier 1 evaluation to escalation to Tier 2 or Tier 3 personnel are defined.
Based on the workflow, resources can be effectively allocated.
One of the most frequently used incident response process models is the DOE/CIAC model, which consists of six stages: preparation, identification, containment, eradication, recovery and lessons learned.

Technology

An enterprisewide data collection, aggregation, detection, analytic and management solution is the core technology of a successful SOC.
An effective security monitoring system incorporates data gathered from the continuous monitoring of endpoints (PCs, laptops, mobile devices and servers) as well as networks and log and event sources.
With the benefit of network, log and endpoint data gathered prior to and during the incident, SOC analysts can immediately pivot from using the security monitoring system as a detective tool to using it as an investigative tool, reviewing suspicious activities that make up the present incident, and even as a tool to manage the response to an incident or breach.
Compatibility of technologies is imperative, and data silos are bad—particularly if an organization has an existing security monitoring solution (SIEM, endpoint, network or other) and wants to incorporate that tool’s reporting into the incident management solution.

Adding Context to Security Incidents

The incorporation of threat intelligence, asset, identity and other context information is another way that an effective enterprise security monitoring solution can aid the SOC analyst’s investigative process.
Often, an alert is associated with network or host-based activity and, initially, may contain only the suspicious endpoint’s IP address. In order for Network Flows Network Traffic Security Events Identity/ Asset Context Endpoint Data System Logs Threat Intel Feeds SECURITY MONITORING SYSTEM.
Compatible Technologies Aid Detection Data Aggregation for Improved Incident Handling Visibility. By centralizing these various sources of data into a security monitoring system, the SOC gains actionable insight into possible anomalies indicative of threat activity. Action. Based on findings, automated and manual interventions can be made to include patching, firewall modification, system quarantine or reimage, and credential revocation. Analysis.
Security operations analysts can analyze data from various sources and further interrogate and triage devices of interest to scope an incident.
A Roadmap the SOC analyst to investigate the system in question, the analyst generally needs other information, such as the owner and hostname of the machine or DHCP-sourced records for mapping IP and host information at the time of the alert.
If the security monitoring system incorporates asset and identity information, it provides a huge advantage in time and analyst effort, not to mention key factors the analyst can use to prioritize the security incident—generally speaking, higher-value business assets should be prioritized over lower-value assets.

Defining Normal Through Baselining

The ability to create a baseline of activity for users, applications, infrastructure, network and other systems, establishing what normal looks like, is one advantage of aggregated data collected from various enterprise sources.
Armed with the definition of “normal,” detecting suspicious behavior—activities that are in some way outside of the norm— becomes easier.
A properly baselined and configured security monitoring system sends out actionable alerts that can be trusted and often automatically prioritized before getting to the Tier 1 analyst.
one of the top challenges in utilizing log data cited by respondents is the inability to discern normal from suspicious activity.
A best practice is to use platforms that can build baselines by monitoring network and endpoint activity for a period of time to help determine was “normal” looks like and then provide the capability to set event thresholds as key alert drivers.
When an unexpected behavior or deviation of normal activity is detected, the platform creates an alert, indicating further investigation is warranted.
Threat Intelligence
Mature SOCs continually develop the capability to consume and leverage threat intelligence from their past incidents and from information-sharing sources, such as a specialized threat intelligence vendor, industry partners, the cybercrimes division of law enforcement, information-sharing organizations (such as ISACs), or their security monitoring technology vendors.
According to the 2015 SANS Cyberthreat Intelligence (CTI) Survey, 69% of respondents reported that their organization implemented some cyberthreat intelligence capability, with 27% indicating that their teams fully embrace the concept of CTI and integrated response procedures across systems and staff.
A security monitoring system’s capability to operationalize threat intelligence and use it to help spot patterns in endpoint, log and network data, as well as associate anomalies with past alerts, incidents or attacks, can enhance an organization’s capability to detect a compromised system or user prior to it exhibiting the characteristics of a breach.
In fact, 55% of the respondents of the CTI Survey are currently using a centralized security management system to aggregate, analyze and operationalize their CTI.
Efficient SOC Incident Handling To achieve efficient incident handling, the SOC must avoid bottlenecks in the IR process that moves incidents through Tier 1, into Tier 2, and finally through Tier 3.
Bottlenecks can occur due to too much “white noise,” alerts of little consequence or false-positives that lead to analyst “alert fatigue.”
This phenomenon is a common experience among responders, Incident Response Survey results, where 15% reported responding to more than 20 false-positive alarms originally classified as incidents. When choosing an enterprise security monitoring tool, look for such features as alert threshold customization and the ability to combine many alerts into a single incident.
Also when incidents include additional context, analysts can triage them more quickly, reducing the layers of evaluation that must take place before an issue can be confirmed and quickly mitigated.

Types of SOC

Categorize SOCs that are internal to the constituency into five organizational models of how the team is comprised,

1. Security team.

No standing incident detection or response capability exists. In the event of a computer security incident, resources are gathered (usually from within the constituency) to deal with the problem, reconstitute systems, and then 16 stands down.
Results can vary widely as there is no central watch or consistent pool of expertise, and processes for incident handling are usually poorly defined. Constituencies composed of fewer than 1,000 users or IPs usually fall into this category.

2. Internal distributed SOC.

A standing SOC exists but is primarily composed of individuals whose organizational position is outside the SOC and whose primary job is IT or security related but not necessarily CND related.
One person or a small group is responsible for coordinating security operations, but the heavy lifting is carried out by individuals who are matrixed in from other organizations. SOCs supporting a small- to medium-sized constituency, perhaps 500 to 5,000 users or IPs, often fall into this category.

3. Internal centralized SOC.

A dedicated team of IT and cybersecurity professionals comprise a standing CND capability, providing ongoing services.
The resources and the authorities necessary to sustain the day-to-day network defense mission exist in a formally recognized entity, usually with its own budget. This team reports to a SOC manager who is responsible for overseeing the CND program for the constituency. Most SOCs fall into this category, typically serving constituencies ranging from 5,000 to 100,000 users or IP addresses.

4. Internal combined distributed and centralized SOC.

The SOC is composed of both a central team (as with internal centralized SOCs) and resources from elsewhere in the constituency (as with internal distributed SOCs). Individuals supporting CND operations outside of the main SOC are not recognized as a separate and distinct SOC entity.
For larger constituencies, this model strikes a balance between having a coherent, synchronized team and maintaining an understanding of edge IT assets and enclaves. SOCs with constituencies in the 25,000–500,000 user/IP range may pursue this approach, especially if their constituency is geographically distributed or they serve a highly heterogeneous computing environment.

5. Coordinating SOC.

The SOC mediates and facilitates CND activities between multiple subordinate distinct SOCs, typically for a large constituency, perhaps measured in the millions of users or IP addresses.
A coordinating SOC usually provides consulting services to a constituency that can be quite diverse.
It typically does not have active or comprehensive visibility down to the end host and most often has limited authority over its constituency.
Coordinating SOCs often serve as distribution hubs for cyber intel, best practices, and training. They also can offer analysis and forensics services, when requested by subordinate SOCs.

Capabilities

A SOC satisfies the constituency’s network monitoring and defense needs by offering a set of services.
SOCs have matured and adapted to increased demands, a changing threat environment, and tools that have dramatically enhanced the state of the art in CND operations. We also wish to articulate the full scope of what a SOC may do, regardless of whether a particular function serves the constituency, the SOC proper, or both. As a result, SOC services into a comprehensive list of SOC capabilities.
the SOC’s management chain is responsible for picking and choosing what capabilities best fits its constituency’s needs, given political and resource constraints.
  1. Real-Time Analysis
  2. Intel and Trending
  3. Incident Analysis and Response
  4. Artifact Analysis
  5. SOC Tool Life-Cycle Support
  6. Audit and Insider Threat
  7. Scanning and Assessment
  8. Outreach

Real-Time Analysis

Call Center
Tips, incident reports, and requests for CND services from constituents received via phone, email, SOC website postings, or other methods. This is roughly analogous to a traditional IT help desk, except that it is CND specific.
Real-Time Monitoring and Triage
Triage and short-turn analysis of real-time data feeds (such as system logs and alerts) for potential intrusions.
After a specified time threshold, suspected incidents are escalated to an incident analysis and response team for further study. Usually synonymous with a SOC’s Tier 1 analysts, focusing on real-time feeds of events and other data visualizations.
Note: This is one of the most easily recognizable and visible capabilities offered by a SOC, but it is meaningless without a corresponding incident analysis and response capability, discussed below.

Intel and Trending

Cyber Intel Collection and Analysis
Collection, consumption, and analysis of cyber intelligence reports, cyber intrusion reports, and news related to information security, covering new threats, vulnerabilities, products, and research. Materials are inspected for information requiring a response from the SOC or distribution to the constituency. Intel can be culled from coordinating SOCs, vendors, news media websites, online forums, and email distribution lists.
Cyber Intel Distribution
Synthesis, summarization, and redistribution of cyber intelligence reports, cyber intrusion reports, and news related to information security to members of the constituency on either a routine basis (such as a weekly or monthly cyber newsletter) or a non-routine basis (such as an emergency patch notice or phishing campaign alert).
Cyber
Intel Creation Primary authorship of new cyber intelligence reporting, such as threat notices or highlights, based on primary research performed by the SOC. For example, analysis of a new threat or vulnerability not previously seen elsewhere. This is usually driven by the SOC’s own incidents, forensic analysis, malware analysis, and adversary engagements.
Cyber Intel Fusion
Extracting data from cyber intel and synthesizing it into new signatures, content, and understanding of adversary TTPs, thereby evolving monitoring operations (e.g., new signatures or SIEM content).
Trending
Long-term analysis of event feeds, collected malware, and incident data for evidence of malicious or anomalous activity or to better understand the constituency or adversary TTPs. This may include unstructured, open-ended, deep-dive analysis on various data feeds, trending and correlation over weeks or months of log data, “low and slow” data analysis, and esoteric anomaly detection methods.
Threat Assessment
Holistic estimation of threats posed by various actors against the constituency, its enclaves, or lines of business, within the cyber realm. This will include leveraging existing resources such as cyber intel feeds and trending, along with the enterprise’s architecture and vulnerability status. Often performed in coordination with other cybersecurity stakeholders.

Incident Analysis and Response

Incident Analysis
Prolonged, in-depth analysis of potential intrusions and of tips forwarded from other SOC members. This capability is usually performed by analysts in tiers 2 and above within the SOC’s incident escalation process. It must be completed in a specific time span so as to support a relevant and effective response. This capability will usually involve analysis leveraging various data artifacts to determine the who, what, when, where, and why of an intrusion—its extent, how to limit damage, and how to recover. An analyst will document the details of this analysis, usually with a recommendation for further action.
Tradecraft Analysis
Carefully coordinated adversary engagements, whereby SOC members perform a sustained “down-in-the-weeds” study and analysis of adversary TTPs, in an effort to better understand them and inform ongoing monitoring. This activity is distinct from other capabilities because (1) it sometimes involves ad-hoc instrumentation of networks and systems to focus on an activity of interest, such as a honeypot, and (2) an adversary will be allowed to continue its activity without immediately being cut off completely. This capability is closely supported by trending and malware and implant analysis and, in turn, can support cyber intel creation.
Incident Response Coordination
Work with affected constituents to gather further information about an incident, understand its significance, and assess mission impact. More important, this function includes coordinating response actions and incident reporting. This service does not involve the SOC directly implementing countermeasures.
Countermeasure Implementation
The actual implementation of response actions to an incident to deter, block, or cut off adversary presence or damage. Possible countermeasures include logical or physical isolation of involved systems, firewall blocks, DNS black holes, IP blocks, patch deployment, and account deactivation.
On-site Incident Response
Work with constituents to respond and recover from an incident on-site. This will usually require SOC members who are already located at, or who travel to, the constituent location to apply hands-on expertise in analyzing damage, eradicating changes left by an adversary, and recovering systems to a known good state. This work is done in partnership with system owners and sysadmins.
Remote Incident Response
Work with constituents to recover from an incident remotely. This involves the same work as on-site incident response. However, SOC members have comparatively less hands-on involvement in gathering artifacts or recovering systems. Remote support will usually be done via phone and email or, in rarer cases, remote terminal or administrative interfaces such as Microsoft Terminal Services or Secure Shell (SSH).

Artifact Analysis

Forensic Artifact Handling
Gathering and storing forensic artifacts (such as hard drives or removable media) related to an incident in a manner that supports its use in legal proceedings. Depending on jurisdiction, this may involve handling media while documenting chain of custody, ensuring secure storage, and supporting verifiable bit-by-bit copies of evidence.
Malware and Implant Analysis
Also known as malware reverse engineering or simply “reversing.” Extracting malware (viruses, Trojans, implants, droppers, etc.)from network traffic or media images and analyzing them to determine their nature. SOC members will typically look for initial infection vector, behavior, and, potentially, informal attribution to determine the extent of an intrusion and to support timely response. This may include either static code analysis through decompilation or runtime/execution analysis (e.g., “detonation”) or both. This capability is primarily meant to support effective monitoring and response. Although it leverages some of the same techniques as traditional “forensics,” it is not necessarily executed to support legal prosecution.
Forensic Artifact Analysis
Analysis of digital artifacts (media, network traffic, mobile devices) to determine the full extent and ground truth of an incident, usually by establishing a detailed timeline of events. This leverages techniques similar to some aspects of malware and implant analysis but follows a more exhaustive, documented process. This is often performed using processes and procedures such that its findings can support legal action against those who may be implicated in an incident.

SOC Tool Life-Cycle Support

Border Protection Device O&M
Operation and maintenance (O&M) of border protection devices (e.g., firewalls, Web proxies, email proxies, and content filters). Includes updates and CM of device policies, sometimes in response to a threat or incident. This activity is closely coordinated with a NOC.
SOC Infrastructure O&M
O&M of SOC technologies outside the scope of sensor tuning. This includes care and feeding of SOC IT equipment: servers, workstations, printers, relational databases, trouble-ticketing systems, storage area networks (SANs), and tape backup. If the SOC has its own enclave, this will likely include maintenance of its routers, switches, firewalls, and domain controllers, if any. This also may include O&M of monitoring systems, operating systems (OSes), and hardware. Personnel who support this service have “root” privileges on SOC equipment.
Sensor Tuning and Maintenance
Care and feeding of sensor platforms owned and operated by the SOC: IDS, IPS, SIEM, and so forth. This includes updating IDS/IPS and SIEM systems with new signatures, tuning their signature sets to keep event volume at acceptable levels, minimizing false positives, and maintaining up/down health status of sensors and data feeds. SOC members involved in this service must have a keen awareness of the monitoring needs of the SOC so that the SOC may keep pace with a constantly evolving consistency and threat environment. Changes to any in-line prevention devices (HIPS/NIPS) are usually coordinated with the NOC or other areas of IT operations. This capability may involve a significant ad-hoc scripting to move data around and to integrate tools and data feeds.
Custom Signature Creation
Authoring and implementing original detection content for monitoring systems (IDS signatures, SIEM use cases, etc.) on the basis of current threats, vulnerabilities, protocols, missions, or other specifics to the constituency environment. This capability leverages tools at the SOC’s disposal to fill gaps left by commercially or community-provided signatures. The SOC may share its custom signatures with other SOCs.
Tool Engineering and Deployment
Market research, product evaluation, prototyping, engineering, integration, deployment, and upgrades of SOC equipment, principally based on free or open source software (FOSS) or commercial off-the-shelf (COTS) technologies. This service includes budgeting, acquisition, and regular recapitalization of SOC systems. Personnel supporting this service must maintain a keen eye on a changing threat environment, bringing new capabilities to bear in a matter of weeks or months, in accordance with the demands of the mission.
Tool Research and Development
Research and development (R&D) of custom tools where no suitable commercial or open source capability fits an operational need. This activity’s scope spans from code development for a known, structured problem to multiyear academic research applied to a more complex challenge.

Audit and Insider Threat

Audit Data Collection and Distribution
Collection of a number of security-relevant data feeds for correlation and incident analysis purposes. This collection architecture may also be leveraged to support distribution and later retrieval of audit data for on-demand investigative or analysis purposes outside the scope of the SOC mission. This capability encompasses long-term retention of security-relevant data for use by constituents outside the SOC.
Audit Content Creation and Management
Creation and tailoring of SIEM or log maintenance (LM) content (correlation, dashboards, reports, etc.) for purposes of serving constituents’ audit review and misuse detection. This service builds on the audit data distribution capability, providing not only a raw data feed but also content built for constituents outside the SOC.
Insider Threat Case Support
Support to insider threat analysis and investigation in two related but distinct areas: 1. Finding tip-offs for potential insider threat cases(e.g., misuse of IT resources, time card fraud, financial fraud, industrial espionage, or theft).
The SOC will tip off appropriate investigative bodies (law enforcement, Inspector General [IG], etc.) with a case of interest. 2. On behalf of these investigative bodies, the SOC will provide further monitoring, information collection, and analysis in support of an insider threat case.
Insider Threat Case Investigation
The SOC leveraging its own independent regulatory or legal authority to investigate insider threat, to include focused or prolonged monitoring of specific individuals, without needing support or authorities from an external entity. In practice, few SOCs outside the law enforcement community have such authorities, so they usually act under another organization’s direction

Scanning and Assessment

Network Mapping
Sustained, regular mapping of constituency networks to understand the size, shape, makeup, and perimeter interfaces of the constituency, through automated or manual techniques. These maps often are built in cooperation with—and distributed to—other constituents.
Vulnerability Scanning
Interrogation of consistency hosts for vulnerability status, usually focusing on each system’s patch level and security compliance, typically through automated, distributed tools. As with network mapping, this allows the SOC to better understand what it must defend. The SOC can provide this data back to members of the constituency—perhaps in report or summary form. This function is performed regularly and is not part of a specific assessment or exercise
Vulnerability Assessment
Full-knowledge, open-security assessment of a constituency site, enclave, or system, sometimes known as “Blue Teaming.” SOC members work with system owners and sysadmins to holistically examine the security architecture and vulnerabilities of their systems, through scans, examining system configuration, reviewing system design documentation, and interviews.
This activity may leverage network and vulnerability scanning tools, plus more invasive technologies used to interrogate systems for configuration and status. From this examination, team members produce a report of their findings, along with recommended remediation. SOCs leverage vulnerability assessments as an opportunity to expand monitoring coverage and their analysts’ knowledge of the constituency
Penetration Testing
No-knowledge or limited-knowledge assessment of a specific area of the constituency, also known as “Red Teaming.” Members of the SOC conduct a simulated attack against a segment of the constituency to assess the target’s resiliency to an actual attack.
These operations usually are conducted only with the knowledge and authorization of the highest level executives within the consistency and without forewarning system owners. Tools used will actually execute attacks through various means: buffer overflows, Structured Query Language (SQL) injection, and input fuzzing. Red Teams usually will limit their objectives and resources to model that of a specific actor, perhaps simulating an adversary’s campaign that might begin with a phishing attack.
When the operation is over, the team will produce a report with its findings, in the same manner as a vulnerability assessment. However, because penetration testing activities have a narrow set of goals, they do not cover as many aspects of system configuration and best practices as a vulnerability assessment would.
In some cases, SOC personnel will only coordinate Red-Teaming activities, with a designated third party performing most of the actual testing to ensure that testers have no previous knowledge of constituency systems or vulnerabilities.

Outreach

Product Assessment
Testing the security features of point products being acquired by constituency members. Analogous to miniature vulnerability assessments of one or a few hosts, this testing allows in-depth analysis of a particular product’s strengths and weaknesses from a security perspective. This may involve “in-house” testing of products rather than remote assessment of production or preproduction systems.
Security Consulting
Providing cybersecurity advice to constituents outside the scope of CND; supporting new system design, business continuity, and disaster recovery planning; cybersecurity policy; secure configuration guides; and other efforts.
Training and Awareness Building
Proactive outreach to constituents supporting general user training, bulletins, and other educational materials that help them understand various cybersecurity issues. The main goals are to help constituents protect themselves from common threats such as phishing/pharming schemes, better secure end systems, raise awareness of the SOC’s services, and help constituents correctly report incidents
Situational Awareness
Regular, repeatable repackaging and redistribution of the SOC’s knowledge of constituency assets, networks, threats, incidents, and vulnerabilities to constituents. This capability goes beyond cyber intel distribution, enhancing constituents’ understanding of the cybersecurity posture of the constituency and portions thereof, driving effective decision-making at all levels. This information can be delivered automatically through a SOC website, Web portal, or email distribution list.
Redistribution of TTPs
Sustained sharing of SOC internal products to other consumers such as partner or subordinate SOCs, in a more formal, polished, or structured format. This can include almost anything the SOC develops on its own (e.g., tools, cyber intel, signatures, incident reports, and other raw observables). The principle of quid pro quo often applies: information flow between SOCs is bidirectional.
Media Relations
Direct communication with the news media. The SOC is responsible for disclosing information without impacting the reputation of the constituency or ongoing response activities.

Summary

As you tackle the challenge of building a security operations center (SOC), your ability to anticipate common obstacles will facilitate smooth startup, build-out, and maturation over time. Though each organization is unique in its current security posture, risk tolerance, expertise, and budget, all share the goals of attempting to minimize and harden their attack surface and swiftly detecting, prioritizing and investigating security incidents when they occur.
References
https://www.sans.org/reading-room/whitepapers/analyst/building-world-class-security-operations-center-roadmap-35907
https://www.mitre.org/sites/default/files/publications/pr-13-1028-mitre-10-strategies-cyber-ops-center.pdf
http://www.mcafee.com/in/resources/white-papers/foundstone/wp-creating-maintaining-soc.pdf
source: https://gbhackers-com.cdn.ampproject.org/c/s/gbhackers.com/how-to-build-and-run-a-security-operations-center/amp/

Taiwan Excellence Gelar “Hadiah” ICT Canggih Untuk Indonesia

$
0
0
Dari kiri ke kanan: Danny Liao (Director Taiwan Trade Center Jakarta), Tony Lin (Deputy Executive Director of Strategic Marketing Department of TAITRA, TAiwan), Phoebe Yeh (Deputy Representative of Taipei Economic and Trade Office), Soegiharto Santoso (Ketua Asosiasi Pengusaha TIK Nasional), Franky Christian, Vice Chairman of ASISINDO
Teknopreneur.com–Taiwan Excellence sebuah gebrakan pasar ekonomi  digital, mulai masuk dan berekspansi dalam pangsa pasar Indonesia. Tahun ini gerakan langkah strateginya dimulai dari pameran Communic Indonesia 2017, yang diselengarakan di Jakarta International Expo, Rabu (25/10) tepatnya di PRJ Kemayoran, Jakarta Utara.
Dalam partisipasinya dirangkaian acara Communic Indonesia 2017 Taiwan Excellence bergairah membawa 22 merek ternama untuk ditawarkan dalam pameran dengan gengsi  International tersebut. Dengan membawa merk brand seperti  Acer BYOC, Gigabyte, Advantech, dan masih banyak lagi. pergerakan pasar Taiwan bukan hanya membawa “hadiah” dengan satu tangan saja, namun ia pun tak ragu-ragu untuk membawa dan memperagakan kemajuan teknologinya dengan  platform aplikasi Internet of Things (IoT), dan beberapa kemampuan ICT berkemampuan integrasi tinggi, sehingga diasumsikan akan membuka peluang kerjasama yang besar antara Taiwan dengan Indonesia.
Ketua Asosiasi Komputer Nasional  Indonesia, Mr. Hoky mengungkapkan, bahwa negara Taiwan selalu dikenal sebagai negara penghasil  ICT, menurutnya itu merupakan ketertarikan dan penggerak awal untuk menjalin kerja sama antara Taiwan dan Indonesia.
“Taiwan selalu dikenal dengan kemajuan dibidang ICT,” ungkap Mr.Hoky.
Ia menambahkan, pada kesempatan kali ini pihaknya mengklaim bahwa salah satu pesertanya yang mengikuti  ajang pameran bergengsi tersebut, telah mendapatkan peluang kerjasama dengan perusahaan system integrasi Indonesia seperti PT. Harrisma dan PT.Nec Indonesia.
Dinilai sebagai penghasil ICT terbesar, pada tahun 2017 tepatnya di semester pertama, ia mengungkapkan ekspor untuk produk Taiwan telah mencapai nilai sebesar USD690 juta, mengantarkan negara tersebut sebagai negara pengekspor ICT keempat di dunia. Baginya bukan hanya sampai pada prestasinya, melainkan Taiwan dibeberapa tahun terakhir telah membuat solusi yang sangat terintegrasi, seperti produk-produk yang ditawarkan di ajang pameran Communic Indonesia 2017.
“Seperti Acer abSignage, yang menyediakan layanan one-stop kepada perusahaan dan mengintegrasikan perangkat lunak, perangkat keras,” kata Mr.Hoky.
Untuk diketahui, bahwa pameran yang saat ini sedang berjalan ialah pameran yang kedua kalinya, bekerjasama dengan Kementerian Komunikasi dan Informatika , Asosiasi Penyedia Jasa Internet Indonesia (APJII), Asosiasi  Data Center Indonesia, dan sejumlah asosiasi pengusaha lainnya.
“Menarik ada 266 perusahaan dari 28 negara berpartisipasi dalam pameran, dan lebih dari 10.000 pengunjung yang datang pada ajang pameran ini,” tutupnya. WES
source: http://teknopreneur.com/2017/10/26/taiwan-excellence-gelar-hadiah-ict-canggih-untuk-indonesia/
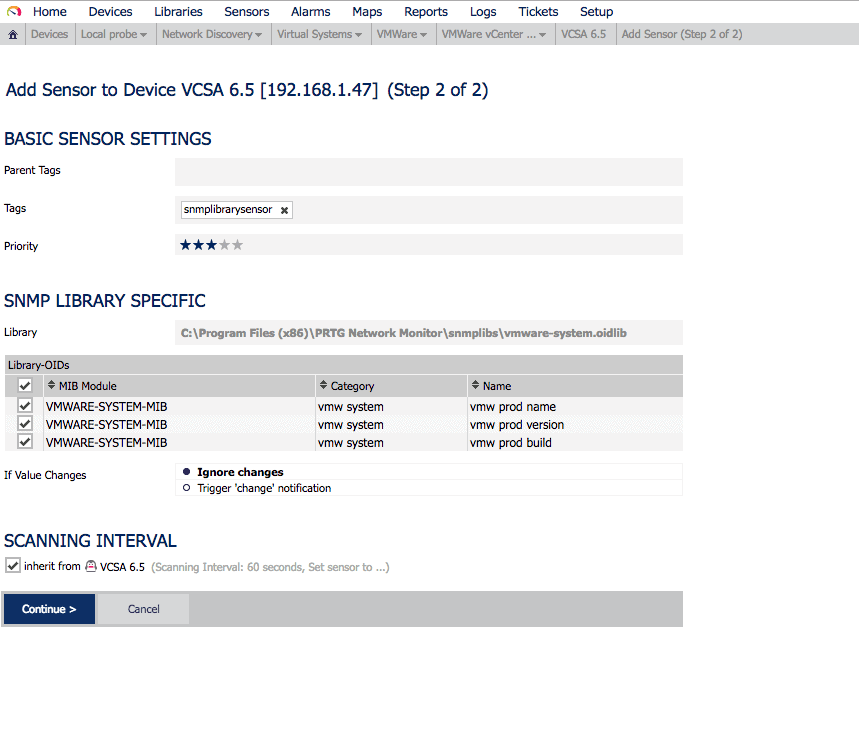
Peranan Smart Home+City Indonesia 2018 Wujudkan 100 Smart City di Indonesia

$
0
0


SUARAINDONEWS.COM, Jakarta-Pameran dan Konferensi Internasional Smart Home+City Indonesia 2018, 3-5 Mei 2018 di JIExpo Kemayoran – Jakarta, menjadi ajang bagi para pelaku industri teknologi rumah pintar, bangunan pintar, serta kota pintar untuk menawarkan solusi cerdas guna membantu kota-kota di Indonesia bertansformasi menjadi kota pintar.
Sekaligus pameran dan konferensi internasional oleh GEM Indonesia ini mampu mendukung dan mendorong terwujudnya 100 smart city yang dicanangkan oleh pemerintah Indonesia.
Pameran Smart Home+City Indonesia 2018 diadakan bersamaan dengan pameran Smart IoT Indonesia 2018 dan SecurityTech Indonesia 2018, yang mendapatkan dukungan positif dari berbagai asosiasi berpengaruh di Indonesia. Diantaranya APTIKNAS (Asosiasi Pengusaha TIK Nasional) di bawah kepemimpinan Ir. Soegiharto Santoso, selaku asosiasi pertama yang mendukung digelarnya pameran Smart Home+City Indonesia perdana pada 17-19 Mei 2017 lalu.
Kemudian diikuti oleh ABDI (Asosiasi Big Data Indonesia) yang diketuai Rudi Rusdiah juga turut berpartisipasi dalam mendukung terlaksananya pameran yang akan kembali digelar kedua kalinya pada tahun 2018 mendatang. Asosiasi pendukung lainnya seperti ASISINDO (Asosiasi Sistem Integrator dan Sekuriti Indonesia) diwakili Fanky Christian selaku Wakil Ketua Umum dan ACCI (Asosiasi Cloud Computing Indonesia) yang dipimpin Alex Budiyanto, yang juga turut menyukseskan pameran dagang internasional yang berfokus pada industri rumah pintar, bangunan pintar, kota pintar, jaringan telekomunikasi, dan juga teknologi Internet of Things (IoT) tersebut.
Untuk membedakan dan sebagai ciri khas expo tahun 2018 nanti, dibanding expo-expo lainnya yang ada, menurut Ir. Soegiharto Santoso, yang juga Ketua Umum Apkomindo serta Pendiri Lembaga Sertifikasi Profesi (LSP) Komputer, menegaskan bahwa Expo 2018 nanti akan juga menyelenggarakan seminar, workshop dan pelatihan serta uji kompetensi keahlian komputer bidang desain grafis junior, serta programming junior maupun lain-lainnya.
Expo ini diharapkan mampu mengajak generasi milenial baik yang belum bekerja atau yang sudah bekerja untuk mengikuti seminar, workshop dan pelatihan serta uji kompetensi berbasis SKKNI (rumusan kemampuan kerja yang mencakup aspek Pengetahuan (knowledge), Keterampilan dan/atau Keahlian (skills) serta Sikap kerja (attitude) yang relevan dengan pelaksanaan tugas dan syarat jabatan yang ditetapkan sesuai dengan ketentuan peraturan perundang-undangan yang berlaku. Tujuannya agar para para SDM kita memang mempunyai kompetensi berbasis SKKNI dibidangnya.
Sementara itu, Baki Lee selaku pimpinan PT. Global Expo Management (GEM Indonesia), dalam sebuah kesempatan memaparkan bahwa,“ Indonesia yang memiliki populasi 250 juta penduduk ini memiliki peluang yang sangat besar dalam menciptakan pasar Internet of Things (IoT). Fakta mengenai baru 20% dari jumlah 250 juta penduduk yang menggunakan internet membuat potensi untuk mengembangkan IoT sangatlah tinggi. Salah satu manfaat IoT dan potensi yang besar juga karena potensi untuk meningkatkan konektivitas internet. Untuk menciptakan satu kesatuan bernama smart city memang membutuhkan kesatuan dari berbagai elemen.”
Dua dari beberapa dimensi yang harus dipenuhi dalam sebuah Smart City, di antaranya adalah dimensi keamanan dan dimensi lingkungan. Sementara produk teknologi yang dapat mendorong terwujudnya smart city adalah e-gov, security & surveillance system, serta bahan bakar hemat energi dan rendah polusi seperti solarcell.
Untuk mendukung terwujudnya kesatuan dimensi tersebut, maka GEM Indonesia menghadirkan pameran Smart Home+City Indonesia di sektor rumah dan bangunan pintar, Smart IoT Indonesia di bidang Internet of Things, SecurityTech Indonesia di bidang security, fire, dan safety system, INALIGHT untuk smart lighting, dan Solartech Indonesia untuk panel surya.
Event terpadu ini diproyeksikan akan diikuti lebih 600 peserta pameran dari 25 negara dan akan dihadiri oleh lebih dari 20.000 pengunjung dalam dan luar negeri. Selain pameran dagang paling komprehensif, GEM Indonesia juga akan menyelenggarakan konferensi internasional yaitu Indonesia IoT & Smart City Conference 2018 yang akan menghadirkan pembicara internasional dan nasional yang mewakili unsur pemerintah, asosiasi, dunia usaha, maupun akademisi.
Event ini diadakan tidak hanya sebagai wadah pertukaran informasi mengenai teknologi atau regulasi terkini namun juga bertujuan sebagai wadah kerja sama yang sangat strategis antara pemerintah daerah, swasta, dan pemegang keputusan.
(tjo; foto ist
SOURCE: http://suaraindonews.com/peranan-smart-homecity-indonesia-2018-wujudkan-100-smart-city-di-indonesia/

Smart Home+City 2018 Gambarkan Terwujudnya 100 Kota Pintar Indonesia

$
0
0
Smart Home+City 2018 Gambarkan Terwujudnya 100 Kota Pintar Indonesia
Mendorong terwujudnya 100 smart city yang dicanangkan oleh pemerintah Indonesia, PT Global Expo Management Indonesia (GEM Indonesia) akan menyelenggarakan pameran teknologi rumah, bangunan serta kota pintar atau Smart Home+City Indonesia 2018. Berlangsung pada 3 sampai 5 Mei 2018 di JIExpo, Kemayoran, Jakarta. Akan diikuti lebih dari 600 peserta dari 25 negara dan akan dihadiri oleh lebih dari 20.000 pengunjung dalam maupun luar negeri. Sebanyak 800 Kepala Daerah juga dijadwalkan akan hadir dalam pameran tersebut. Menghadirkan pembicara internasional dan nasional yang mewakili unsur pemerintah, asosiasi, dunia usaha, maupun akademisi.
Pameran Smart Home city Indonesia 2018 diadakan bersamaan dengan pameran Smart IoT Indonesia 2018 dan Security Tech Indonesia 2018. Smart Home City Indonesia 2018 disektor rumah dan bangunan pintar, Smart IoT Indonesia 2018 dibidang internet of things, SecurityTech Indonesia 2018 di bidang security, fire, dan safety system, Inalight 2018 untuk smart lighting, dan Solartech Indonesia untuk Smart Energy.
Keterangan Gambar (© Pemilik Gambar)
press conference Smart Home+City 2018 (© suaraindonews.com)
Acara ini telah mendapatkan dukungan positif dari berbagai asosiasi berpengaruh  di Indonesia, seperti Asosiasi Pengusaha TIK Nasional (APTIKNAS) di bawah kepemimpinan Ir. Soegiharto Santoso, selaku asosiasi pertama yang mendukung digelarnya pameran Smart Home+City Indonesia perdana pada 17-19 Mei 2017 lalu. Diikuti oleh ABDI (Asosiasi Big Data Indonesia) yang diketuai Rudi Rusdiah juga turut berpartisipasi dalam mendukung terlaksananya pameran yang akan kembali digelar kedua kalinya pada tahun 2018 mendatang.
Asosiasi pendukung lainnya seperti ASISINDO (Asosiasi Sistem Integrator dan Sekuriti Indonesia) diwakili Fanky Christian selaku Wakil Ketua Umum dan ACCI (Asosiasi Cloud Computing Indonesia) yang dipimpin Alex Budiyanto, yang juga turut menyukseskan pameran dagang internasional yang berfokus pada industri rumah pintar, bangunan pintar, kota pintar, jaringan telekomunikasi, dan juga teknologi Internet of Things (IoT) tersebut.
Negara yang memiliki populasi  250  juta penduduk dan 20% menggunakan internet, Indonesia memiliki peluang yang sangat besar dalam menciptakan pasar Internet of Things (IoT). Salah satu manfaat IoT dan potensi yang besar juga karena potensi untuk meningkatkan konektivitas internet. Untuk menciptakan satu kesatuan bernama smart city memang membutuhkan kesatuan dari berbagai elemen.
Salah  satu elemen penting yang dapat menjadikan sebuah smart city adalah Sumber Daya Manusia (SDM). Untuk mengangkat kualitas SDM agar dapat bersaing di zaman yang serba digital nantinya banyak dibutuhkan dukungan dari berbagai pihak. Terdapat beberapa dimensi juga untuk dipenuhi, dua diantaranya adalah keamanan dan lingkungan.Sedangkan untuk produk teknologi yang dapat mendorong terwujudnya smart city sepertie-gov, security & surveillance  system, bahan bakar hemat energy dan rendah polusi seperti solarcell.
Untuk mewujudkan semua elemen, maka diselenggarakan pameran ini, tidak hanya sebagai wadah pertukaran informasi mengenai teknologi atau regulasi terkini namun juga bertujuan sebagai wadah kerja sama yang sangat strategis antara pemerintah daerah, swasta, dan pemegang keputusan. Sekaligus menjadi ajang bagi para pelaku industri teknologi rumah pintar, bangunan pintar, serta kota pintar untuk menawarkan solusi cerdas guna membantu kota-kota di Indonesia bertansformasi menjadi kota pintar.
Expo ini diharap mampu mengajak generasi milenial, baik yang belum atau yang sudah bekerja, agar memiliki kompetisi berbasis SKKNI di bidangnya, yang mencakup aspek Pengetahuan (knowledge), Keterampilan dan/atau Keahlian (skills) serta Sikap Kerja (attitude) yang relevan dengan pelaksanaan tugas dan syarat jabatan yang ditetapkan sesuai dengan ketentuan peraturan perundang-undangan yang berlaku.
Keterangan Gambar (© Pemilik Gambar)
Ilustrasi Smart City (© geospatialmedia.s3.amazonaws.com)

Sumber: indosecuritysystem.com | suaraindonews.com | metroheadline.id
SOURCE: https://www.goodnewsfromindonesia.id/2017/11/06/smart-home-city-2018-gambarkan-terwujudnya-100-kota-pintar-indonesia
Viewing all 2830 articles
Browse latest View live